All services are nominal
If you notice a problem, please send us an email via the Contact Us menu of the app.
Average time of model updates on the SailGrib grib server
| Source | Model | Runtime | Available at (TU) |
| NOAA | GFS 025 | 00Z | 5:45 |
| NOAA | GFS 025 | 06Z | 11:45 |
| NOAA | GFS 025 | 12Z | 17:45 |
| NOAA | GFS 025 | 18Z | 23:45 |
| NOAA | GFS 050 | 00Z | 5:30 |
| NOAA | GFS 050 | 06Z | 11:30 |
| NOAA | GFS 050 | 12Z | 17:30 |
| NOAA | GFS 050 | 18Z | 23:30 |
| NOAA | GFS 100 | 00Z | 5:25 |
| NOAA | GFS 100 | 06Z | 11:25 |
| NOAA | GFS 100 | 12Z | 17:25 |
| NOAA | GFS 100 | 18Z | 23:25 |
| NOAA | NAM CONUS | 00Z | 3:30 |
| NOAA | NAM CONUS | 06Z | 9:30 |
| NOAA | NAM CONUS | 12Z | 15:30 |
| NOAA | NAM CONUS | 18Z | 21:30 |
| NOAA | NAM CONUS NEST | 00Z | 3:20 |
| NOAA | NAM CONUS NEST | 06Z | 9:20 |
| NOAA | NAM CONUS NEST | 12Z | 15:20 |
| NOAA | NAM CONUS NEST | 18Z | 21:20 |
| Météo France | Arôme | 00Z | 3:00 |
| Météo France | Arôme | 06Z | 11:30 |
| Météo France | Arôme | 12Z | 16:15 |
| Météo France | Arôme | 18Z | 23:30 |
| Météo France | Arpège Europe | 00Z | 4:00 |
| Météo France | Arpège Europe | 12Z | 15:45 |
| Météo France | Arpège Monde | 00Z | 4:00 |
| Météo France | Arpège Monde | 12Z | 15:45 |
Since version 7.0 released in February 2023, the application files are no longer stored in the sailgrib directory of the main memory of the device.
Google forces us to put them in a hidden directory ( /storage/emulated/0/Android/data/com.sailgrib_wr.paid/files/sailgrib/) .
The most visible consequence for users is that if you save a grib file from an email for example, it is no longer directly visible by SailGrib WR.
You have to import it.
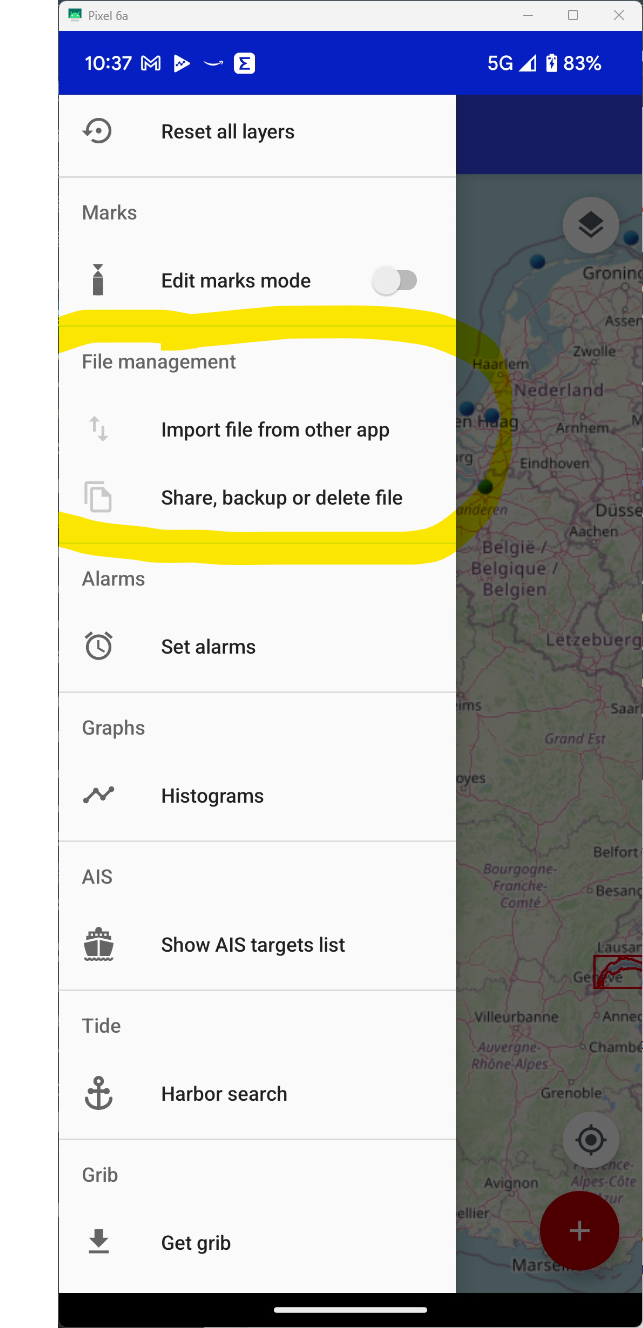
To do this, we have created a new Menu "Import a file".
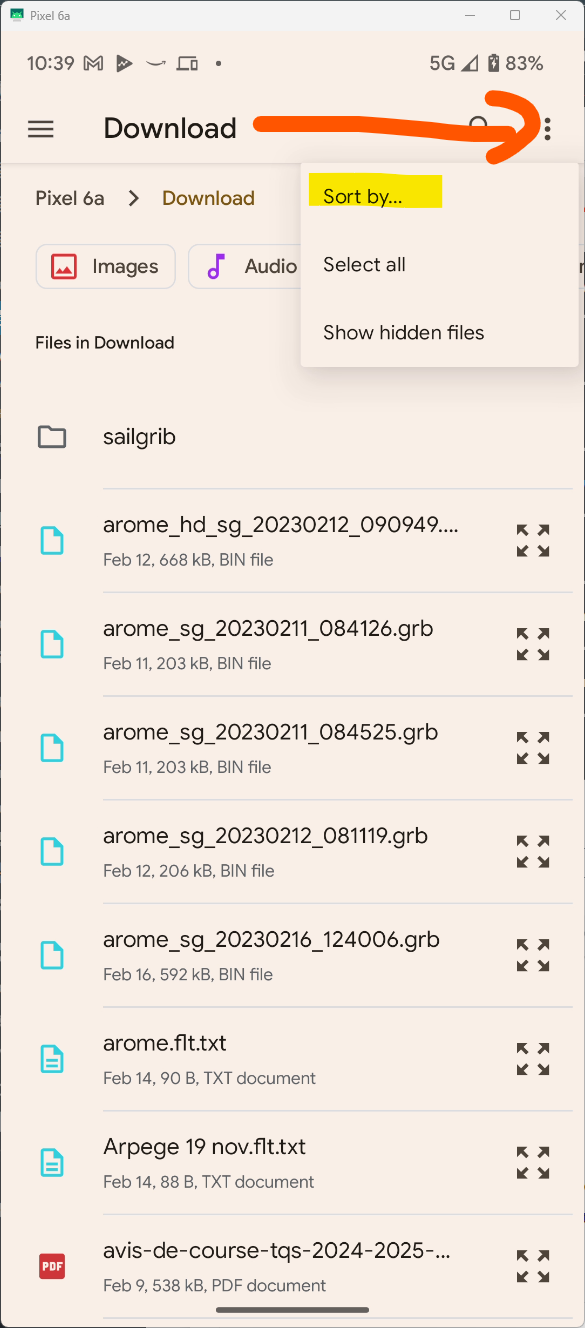
The application will search for files by default in the Download directory.
You can sort them by date to have the most recent files at the top of the list
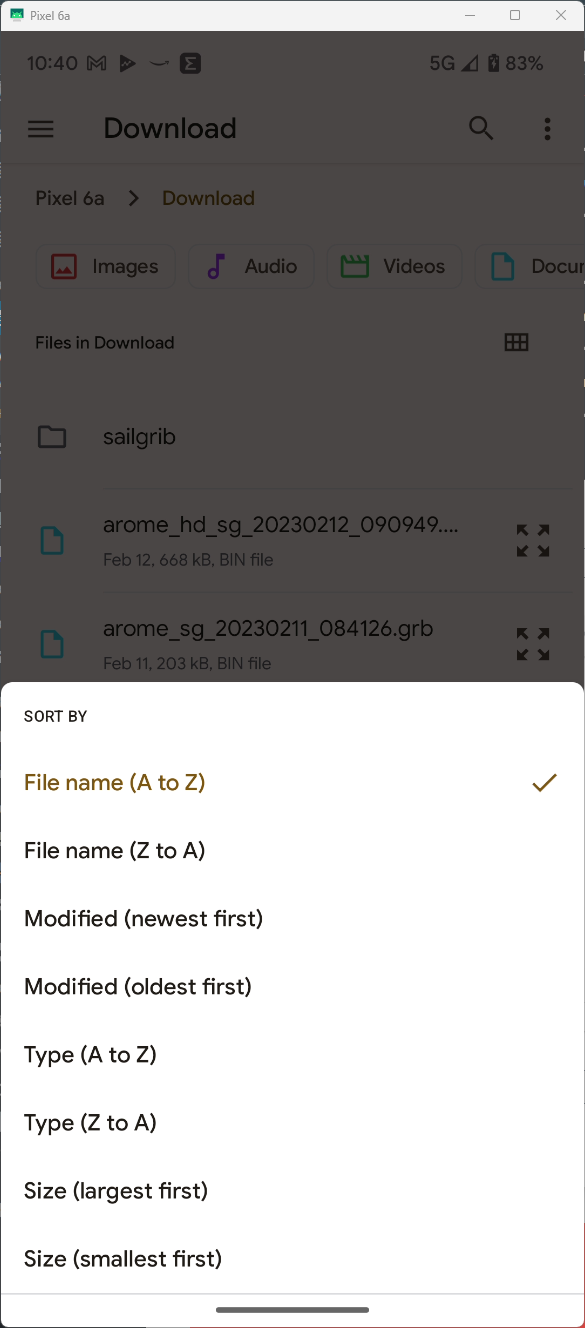
Choose the file to import, it will be copied and available in the application.
Since version 7.0 released in February 2023, the application files are no longer stored in the sailgrib directory of the device's main memory.
Google forces us to put them in a hidden directory (/storage/emulated/0/Android/data/com.sailgrib_wr.paid/files/sailgrib/).
The most visible consequence for the users is that if you want to share for example a route, you can't do it with a file manager anymore.
For this we have created a new Menu "Share, save or delete a file".
If you decide to save a file, it will be saved in a subdirectory of download/sailgrib
- Press the
 button
 - Press the "GRIB REQUEST" button
- Choose the source of the grib files, usually SailGrib but you can also use Open WRF, SailDocs, Great Circle...
- Choose the weather or current forecast model. The most common is the GFS or :
- in coastal navigation along European coasts, the Arpège 0.1° model of Météo France
- in coastal navigation along the US coasts or on the Great Lakes, the NAM model from the NOAA
- Choose the time step and number of days.
- Select the parameters to be loaded, usually Wind and Pressure or Current
- Press the "REQUEST GRIB" button at the top of the screen
- The file is created on the SailGrib server, sent back to the app and opened in the app.
[youtube id="JZALa7RAqrk" width="600" height="350" autoplay="no" api_params="" class=""]
Iridium has been selling the Iridium Go since Q3 2014. The unit connects quickly and automatically to Iridium satellites and creates a Wi-Fi hotspot i your boat. You can use the Go with your smartphone (iPod or Android), tablets and computers.
Some suppliers offer prepaid plans with unlimited data for the Go at around 140€/month. It is an excellent choice for an Atlantic crossing.
To start using your Iridium Go, install on your Android device:
- Install the Iridium Go app on your android device:
https://play.google.com/store/apps/details?id=com.iridiumgo - Install the Mail and Web app on your android device:
https://play.google.com/store/apps/details?id=com.iridium.mailandweb
- Register with Iridium to get a specific "Iridium" email address ending with @myiridium.net :
https://www.iridium.com/mailandweb/
If your provider is GMN-XGate, install the XGate Satellite Email & Web app instead of Iridium Mail & Web and there is no need to create an @myiridium.net email address, XGate will give you an @gmn-usa.com address.
- press the
 button
 - press the REQUEST GRIB button
- select a source: SailGrib or SailGrib optimized for Iridium
- select a model
- adjust the other parameters to get a reasonable estimate file size. We advise to have it at 70ko or under. You can download larger files but it will take some time. Count on 10ko per minute.
- set the request mode to Direct download
- check the box Make the request with your Iridium Go
- press the LAUNCH GRIB REQUEST button
-
the app waits for a signal of at least 3 bars to attempt a connection.
-
once connected to the network, the grib request is sent to the SailGrib server
-
the server creates a file and sends its name and size back to SailGrib WR
-
SailGrib WR starts downloading the file.
-
If the connection is interrupted during the download, SailGrib WR will attempt to establish a new connection and resume the download where it stopped.
-
Watch the video of a download
You will get a grib file with an email exchange:
- press the
 button
 - press the REQUEST GRIB button
- select a source: SailDocs or SailGrib
- select a model, usually the GFS
- if you picked SailGrib as a source, set the request mode to Email
- at the bottom of the screen, check the box "Make the grib request with Iridium Mail" and enter your iridium email address
- press the LAUNCH GRIB REQUEST button. An e-mail is prepared and sent to the "Iridium Mail & Web" app
In the Iridium Mail & Web app:
- send the email with the iridium network
- wait for 5 minutes
- press the send/receive button again. You should have received an email from SailDocs or SailGrib with a grib file attached
- save the grib file
In SailGrib:
- press the
 button
 - press the OPEN GRIB button
- choose the grib in the list, the last one saved is at the top of the list
The maximum reasonable maximum size of an grib received by iridium is about 70 kb, adjust your settings accordingly. For example, to get the whole Atlantic, set the grid resolution to 2.5°.
But most of all, practice on the ground before you set sails. First in 3G or WiFi to make sure you set the settings correctly to get a grib file size of 70kb or less. Then, with the iridium Go to get a file in near-real conditions. It is preferable to use an external antenna with the iridium Go. If you haven't put the Go outside, it will work better.
One of SailGrib's special features is the ability to load grib files from multiple providers called Sources in the app. Each of the Sources gives access to different Models.
Below you will find a list of the different models supplied, sorted by supplier:
The grib server we created should be your default source when you are connected to the Internet. It provides grib files of weather forecasts (wind, pressure, cloud, rain), waves, ocean currents and tidal currents. We access 4 suppliers: NOAA the US National Oceanic and Atmospheric Administration , Météo France, the German Weather Service DWD and Copernicus, the Europe's eyes on Earth.
Wind, Pressure: GFS, Arpège Monde, Arpège Europe, Arôme, ICON EU, NAM, NAM Nest
Waves: WW3
Ocean currents: Global, global Met
Tidal currents: IBI, ENWS, Baltic, Med
1 - NOAA Models
- GFS: This is a global model that covers the entire globe. The data are available on a grid of 0.25° (27km) every 3 hours, from 0 to 192 hours and then on a grid of 2.5° beyond, up to 384 hours (16 days). Data are calculated for 00:00,06:00,12:00 and 18:00 GMT. They are available in HH +05h. Available data are: wind and pressure, clouds and rain. It is used offshore by all sailors, whether cruising or racing.
- NAM and NAM nest: The NAM model covers the United States. Data are available on a 12km (0.12°) grid every hour up to 84 hours. The NAM model is available with a grid of 3km (0.03°) every hour up to 60 hours. Data are calculated for 00:00,06:00,12:00 and 18:00 GMT. They are available in HH +03h30. Available data are: wind and pressure.
- WW3: This is NOAA's WaveWatch III wave model. The model is global but covers only open seas. The data are available on a grid of 0.5° (52km), every 3 hours, from 0 to 180 hours. The data are calculated for 00:00,06:00,12:00,18:00 GMT and are available in HH +06:00. The available parameters are wind, significant wave height, mean direction and mean wave period.
2 - Méteo France models
- Arpège Monde: the Arpège Monde model covers the whole world on a grid of 0.5° (55km). It provides 3 or 4-day forecasts depending on the calculation cycle. The data are calculated at 00:00, 06:00, 12:00, 18:00 GMT and are available approximately in HH +05h.
- Arpège Europe: the Arpège Europe model covers Europe on a grid of 0.1° (12km). It provides 3 or 4-day forecasts depending on the calculation cycle. The data are calculated at 00:00, 06:00, 12:00, 18:00 GMT and are available approximately in HH +05h. The Arpège Europe model is excellent for any offshore navigation in European waters.
- Arôme The Arôme model covers France at a very high resolution of 0.025° (2.5km) over 2 days. The data are calculated at 00:00, 06:00, 12:00, 18:00 GMT and are available approximately in HH +05h. It is a model perfectly adapted for coastal routing in France.
3 - German Weather Service DWD Models - ICON GLOABAL and ICON EU
- The DWD ICON-GLOBAL model, available in SailGrib since June 27, 2021, covers the entire world with a 0.125° (~ 13 km) grid. It provides forecasts for 180 hours (7.5 days). Data are computed at 00:00 and 12:00 GMT and are available about 4 hours later (HH +04:00). The time step for the forecast period up to +78 hours is one hour, the forecast periods between +81 and +120 hours are covered with a 3 hour interval. The ICON-GLOBAL model is the only high resolution model covering the whole world. It is excellent for any navigation and is especially recommended in all areas not covered by other fine mesh models.
- The DWD's regional ICON-EU model came into operation on 21.07.2015. The grid spacing is 0.0625 °(~ 7 km). The ICON-EU forecasts are available up to 5 days. The data are calculated at 00:00, 06:00, 12:00, 18:00 GMT and are available approximately in HH +04h . The time step for the forecast period up to +78 hours is one hour, the forecast periods between +81 and +120 hours are covered by a 3-hourly time step. As the letters 'EU' suggest, the ICON-EU model covers the whole of Europe. In the west and east, however, the model's coverage extends far beyond the European territory, covering the area bounded by the coordinates 23.5°W–62.5°E, 29.5°N–70.5°N. The ICON EU model is excellent for any navigation in European waters.
4 - Copernicus Models - Mercator Ocean
Copernicus is a European ocean observation and prediction project.
- tidal current model (Copernicus IBI): The IBI model (Iberian Biscay Irish) provides a 5-day hydrodynamic forecast that includes tidal current forecasts, those resulting from weather forecasts, river flows, etc. Its resolution is 0.03° (3km) and its time step of 1 hour. As its name indicates, it covers the European Atlantic coasts and the English Channel (26n, 56n, 19w, 5e). It is ideal for routing along these coasts. It covers the Strait of Gibraltar.
- ocean current model (Copernicus Global). The Copernicus Global model provides a 7-day hydrodynamic forecast. Its resolution is 0.08° (9km) and its time step of 24 hours. As its name suggests, it covers all the seas of the Globe. It is ideal for routing in the presence of ocean currents such as the Gulf Stream.
- Ocean Current Model (Copernicus Met Global): The Met Global model provides a 7-day hydrodynamic forecast. Its resolution is 0.25° (27km) and its time step of 24 hours. As its name suggests, it covers all the seas of the Globe. It is ideal for routing in the presence of ocean currents such as the Gulf Stream.
- Baltic Sea tidal current model (Copernicus Baltic): The Baltic model provides a 2-day hydrodynamic forecast. Its resolution is 0.2° (2km) and its time step of 1 hour. As its name implies, it covers the Baltic Sea[Lat: 53N/66N Lon: 9E/30E]".
- Mediterranean Sea Current Model (Copernicus Med): The Med model provides a 9-day hydrodynamic forecast. Its resolution is 0.06° (7km) and its time step of 1 hour. As its name implies, it covers the Mediterranean Sea.
- Northern European Current Model (Copernicus ENWS): The ENWS model provides a 5-day hydrodynamic forecast. Its resolution is 0.06° (7km) and its time step of 1 hour. It covers the European coasts from Portugal. [Lat: 65N/40N Lon: 20W/13E]
SailDocs is a free service that provides grib files through an email exchange: the user sends a request generated by SailGrib via email. It will usually receive an email with a grib file attached within 5 minutes. This service is mainly used offshore with a very low bandwidth Iridium connection like an Iridium Go.
- GFS: most often used. Produced by NOAA. It is a global model that covers the entire globe. Data are available on a grid of 0.25° (27km) every 3 hours, from 0 to 192 hours, then on a grid of 2.5° (277km) beyond 384 hours (16 days). Data are calculated for 00:00,06:00,12:00 and 18:00 GMT. They are available in HH +05h00. The available data are: wind, pressure, precipitation, cloud cover, air temperature, significant wave height, and CAPE.
- WW3: This is the NOAA WaveWatch III wave model. The model is global. The data are available on a grid of 1 ° (111 km), every 3 hours, from 0 to 180 hours. The data are calculated for 00:00, 06:00, 12:00, 18:00 GMT and are available in HH +06h. The available parameters are wind, significant wave height, mean direction and mean wave period.
- COAMPS: This is a regional model calculated by the US Navy. Data are available for only four regions: Europe and the Mediterranean Sea, the Eastern Pacific, the Western Atlantic, and the Caribbean Sea and Central America. The data are available on a grid of 0.2 ° (22km) in 6-hour intervals, from 0 to 72 hours for Europe and the Mediterranean Sea as well as the Western Atlantic and 48 hours for the other 2 regions. The available parameters are wind and pressure. The following regions are available:
- Europe and the Mediterranean Sea: 29N, 66N, 15W, 45E
- Pacific-East: 29N, 60N, 160W, 114W
- Western Atlantic: 20N, 55N, 093W, 055W
- Caribbean Sea and Central America: 00N, 32n, 120W, 060W
Great Circle is a provider of grib files mainly used by offshore racers through its Squid software. Any user registered on their site can upload grib files with a free subscription. Great circle sells other subscriptions that I invite you to discover on their website. SailGrib gives you access to all the models included in your subscription; simply enter the email address used to register your account as well as your password.
With a free subscription, you will have access to the GFS and GEM models.
- GFS: Produced by NOAA. It is a global model that covers the entire globe. The data are available on a 0.5 °(27km) grid every 3 hours, from 0 to 192 hours, then on a grid of 2.5° beyond 384 hours (16 days). Data are calculated for 00:00, 06:00, 12:00 and 18:00 GMT. They are available in HH +05h.
- GEM: This is a global model produced by the Canadian Meteorological Centre (CMC) that covers the entire globe. Data are available on 0.6° (66km) grid every 3 hours, from 0 to 192 hours. Data are calculated for 00:00, 06:00, 12:00 and 18:00 GMT. They are available in HH +05h.
Open WRF files are produced using the WRF model. The grib files are offered in two resolutions of 0.11° (12 km) with a 5-day forecast and 0.4° (4 km) with 2-day forecast.
In addition to the classic data, gribs include: gusts, a storm indicator, WAM waves, Copernicus marine currents. We recommend that you use these grib files in the Mediterranean.
In addition to its satellite telephony provider activities, GMN (Global Marine Networks) provides free grib files.
The GMN grib server can be accessed by email or download.
This server has 2 unique features:
- if you specify a size limit for the grib file, the server will interpolate the template data to get as close as possible to your limit. This is ideal for Iridium email requests.
- GMN has 2 models in exclusivity:
- Hycom: a model of global ocean currents with high resolution 0.08° (8km). This model is often considered to be the best and especially for the Gulf Stream.
- FNMOC: the Navy's wave model. It covers all the seas of the Globe, including the Mediterranean.
You will also find the models GFSat 1° (111km) and ww3 at 1° (111km).
| Grib update schedule by runtimes (UTC) | |||||||
| |
|
|
|
|
|
|
|
| name | data | provider |
type | 00Z | 06Z | 12Z | 18Z |
| GFS 0.25° | wind | NOAA |
global | 5:40 | 11:40 | 17:40 | 23:50 |
| GFS 0.50° | wind | NOAA |
global | 5:35 | 11:35 | 17:35 | 23:45 |
| GFS 1.00° | wind | NOAA |
global | 5:50 | 11:50 | 17:50 | 0:00 |
| Arpège Monde 0.50° | wind | Meteo France |
global | 4:00 | |
15:35 | |
| ICON GLOBAL 0.125° | wind | DWD |
global | 4:00 | |
16:00 | |
| ICON GLOBAL 0.25° | wind | DWD |
global | 4:00 | |
16:00 | |
| ICON GLOBAL 0.50° | wind | DWD |
global | 4:00 | |
16:00 | |
| ICON GLOBAL 1.00° | wind | DWD |
global | 4:00 | |
16:00 | |
| ICON Europe 0.07° | wind | DWD |
regional | 4:15 | 10:15 | 16:15 | 22:15 |
| Arpège Europe 0.1° | wind | Meteo France |
regional | 5:00 | |
17:45 | |
| Arôme 0.025° | wind | Meteo France |
regional | 3:10 | 12:00 | 17:00 | 23:55 |
| Arôme HD 0.01° | wind | Meteo France |
regional | 5:30 | 11:30 | 17:30 | 23:30 |
| Arôme Antilles 0.025° | wind | Meteo France |
regional | 1:30 | 7:30 | 13:20 | 19:30 |
| NAM CONUS 0.1° | wind | NOAA |
regional | 3:25 | 9:25 | 15:25 | 21:25 |
| NAM CONUS NEST 0.05° | wind | NOAA |
regional | 3:15 | 9:15 | 15:15 | 21:15 |
| HRR CONUS 0.025° | wind | NOAA |
regional | 0:40 | every H+40 | |
|
| WW3 Global 0.5° | wave | NOAA |
global | 5:15 | 11:15 | 17:15 | 23:15 |
| Copernicus Global 0.08° | current | Copernicus |
global | 12:35 | |
|
|
| Copernicus Global MET 0.25° | current | Copernicus |
global | 12:45 | |
|
|
| Copernicus IBI 0.03° | current | Copernicus |
regional | 4:45 | |
|
|
| Copernicus ENWS 0.06° | current | Copernicus |
regional | 12:55 | |
|
|
| Copernicus BALTIC 0.2° | current | Copernicus |
regional | 10:45 | |
|
|
| Copernicus MED 0.06° | current | Copernicus |
regional | 3:45 | |
|
|
| NCOM Alaska - N. Calif 0.03° | current | NCOM |
regional | 16:05 | |
|
|
| NCOM Caribbean 0.03° | current | NCOM |
regional | 16:10 | |
|
|
| NCOM Hawaii 0.03° | current | NCOM |
regional | 16:15 | |
|
|
| NCOM South California 0.03° | current | NCOM |
regional | 14:05 | |
|
|
| NCOM US East Coast 0.03° | current | NCOM |
regional | 11:05 | |
|
|
If grib files are useful to try to understand the weather situation, it is almost necessary to load weather maps to better understand it.
Surface pressure charts, also called isobaric charts, synoptic charts or frontal charts, are commonly used. They allow visualizing:
- warm and cold fronts
- centers of action for highs and lows
- isobars
There are two types of surface pressure charts:
- surface chart analysis
- surface chart forecasts at 24, 48, 72 or 96 hours.
Charts are produced in different projections. The NOAA publishes most of them in Mercator projection which allow us to embed them in the app.
Weather charts are images. When they are available, we have selected those in the TIF format where the files sizes are the smallest.
The charts can be downloaded directly when you have an internet connection or picked up by an exchange of email with SailDocs when you're at sea with Iridium.
|
Source |
Mercator |
Zone |
West |
East |
North |
South |
Description |
File Name |
Size |
|
NOAA |
P |
Atlantic North East |
-45 |
10 |
65 |
20 |
most current-surface analysis 45W-10E 65N-20N |
PYAA11.TIF |
29 |
|
NOAA |
P |
Atlantic North West |
-95 |
-40 |
65 |
20 |
most current-surface analysis 95W-40W 65N-20N |
PYAA12.TIF |
33 |
|
NOAA |
P |
Atlantic North West |
-98 |
-40 |
50 |
25 |
most current-24Hour surface forecast 98W-40W 50N-25N |
PPAE10.TIF |
22 |
|
NOAA |
P |
Atlantic North |
-95 |
10 |
65 |
20 |
most current-48Hour surface forecast 95W-10E 65N-20N |
QDTM10.TIF |
30 |
|
NOAA |
P |
Atlantic North |
-95 |
10 |
65 |
20 |
most current-96Hour surface forecast 95W-10E 65N-20N |
PWAM99.TIF |
30 |
|
NOAA |
P |
Pacific North East |
-175 |
-115 |
65 |
20 |
most current-surface analysis 175W-115W 65N-20N |
PYBA90.TIF |
27 |
|
NOAA |
P |
Pacific North West |
140 |
-170 |
65 |
20 |
most current-surface analysis 140E-170W 65N-20N |
PYBA91.TIF |
29 |
|
NOAA |
P |
Pacific North West |
140 |
-120 |
65 |
20 |
most current-96Hour surface forecast 140E-120W 65N-20N |
PWBM99.TIF |
27 |
|
NOAA |
P |
Pacific Central |
130 |
-110 |
50 |
0 |
most current-surface analysis 130E-110W 50N-0N |
PPBA11.TIF |
29 |
|
NOAA |
P |
Pacific Central |
130 |
-110 |
50 |
-30 |
most current-24Hour surface forecast 130E-110W 50N-30S |
PYFE11.TIF |
28 |
|
NOAA |
P |
Pacific Central |
130 |
-110 |
50 |
-30 |
most current-48Hour surface forecast 130E-110W 50N-30S |
PYFI11.TIF |
28 |
|
NOAA |
P |
Pacific Central |
130 |
-110 |
50 |
-30 |
12Z-72Hour surface forecast 130E-110W 50N-30S |
PYFK11.TIF |
28 |
|
NOAA |
P |
Pacific Central East |
-150 |
-70 |
40 |
-20 |
most current-surface analysis 150W-70W 40N-20S |
PYFA90.TIF |
30 |
|
NOAA |
P |
Pacific Central East |
-140 |
-75 |
30 |
-20 |
most current-24Hour surface forecast 140W-75W 30N-20S |
PYFE10.TIF |
22 |
|
NOAA |
P |
Pacific Central East |
-140 |
-75 |
30 |
-20 |
most current-48Hour surface forecast 140W-75W 30N-20S |
PYFI10.TIF |
22 |
|
NOAA |
P |
Pacific Central East |
-140 |
-75 |
30 |
-20 |
most current-72Hour surface forecast 140W-75W 30N-20S |
PYFK10.TIF |
22 |
|
NOAA |
P |
Tropical Atlantic W - Pacific E |
-145 |
-70 |
40 |
-5 |
most current-surface analysis 145W-70W 40N-5S |
PYFA90.TIF |
30 |
|
NOAA |
P |
Tropical Atlantic |
-70 |
0 |
45 |
-5 |
most current-surface analysis 70W-0E 45N-5S |
PYEA11.TIF |
32 |
|
NOAA |
P |
Tropical Atlantic West |
-100 |
-35 |
35 |
0 |
most current-24Hour surface forecast 100W-35W 35N-0N |
PYEE10.TIF |
22 |
|
NOAA |
P |
Tropical Atlantic West |
-100 |
-35 |
35 |
0 |
most current-48Hour surface forecast 100W-35W 35N-0N |
PYEI10.TIF |
22 |
|
NOAA |
P |
Tropical Atlantic West |
-100 |
-35 |
35 |
0 |
most current-72Hour surface forecast 100W-35W 35N-0N |
PYEK10.TIF |
22 |
|
MetOffice |
û |
Europe |
-50 |
40 |
80 |
30 |
12Z-surface analysis 50W-40E 80N-30N |
PPVA89.TIF |
70 |
|
MetOffice |
û |
Europe |
-50 |
40 |
80 |
30 |
12Z-24Hour surface forecast 50W-40E 80N-30N |
PPVE89.TIF |
70 |
|
MetOffice |
û |
Europe |
-50 |
40 |
80 |
30 |
12Z-36Hour surface forecast 50W-40E 80N-30N |
PPVG89.TIF |
70 |
|
MetOffice |
û |
Europe |
-50 |
40 |
80 |
30 |
12Z-48Hour surface forecast 50W-40E 80N-30N |
PPVI89.TIF |
70 |
|
MetOffice |
û |
Europe |
-50 |
40 |
80 |
30 |
12Z-60Hour surface forecast 50W-40E 80N-30N |
PPVJ89.TIF |
70 |
|
MetOffice |
û |
Europe |
-50 |
40 |
80 |
30 |
12Z-72Hour surface forecast 50W-40E 80N-30N |
PPVK89.TIF |
70 |
|
MetOffice |
û |
Europe |
-50 |
40 |
80 |
30 |
12Z-96Hour surface forecast 50W-40E 80N-30N |
PPVM89.TIF |
70 |
|
MetOffice |
û |
Europe |
-50 |
40 |
80 |
30 |
12Z-120Hour surface forecast 50W-40E 80N-30N |
PPVO89.TIF |
70 |
-
Open the menu
-
Select Get weather chart
- Select from the drop-down menus:
- Zone: Atlantic, Pacific...
- Source: NOAA, MetOffice
- Type: surface chart only for the moment
- Chart: 48 Hour Surface analysis, 96 Hour...
- Choose:
- Request by Direct download if you are on the Internet or if you are uing an Iridium Go while offshore
- Email if you want to make the request by email via SailDocs and an Iridium Go (backup solution)
- Press the Make Weather Chart Request button.
The files are very small and take 1 to 2 seconds to download in WiFi or 4G
- The chart is displayed.
- If the chart is in Mercator projection, we can display it on the main SailGrib WR map.
The chart must then be synchronized.
As the message indicates, you must match the date and time of validity to the "Valid Date" displayed in the chart inset. The application tries to propose the right date and time but the maps being produced by hand, they are not always available at the same times... Note that the times are always in UTC. - If the chart is not in Mercator projection, it is simply displayed here.
- If the chart is in Mercator projection, we can display it on the main SailGrib WR map.
- Press the Open button. The map opens on the application's main map.
The weather charts are saved in the "download" directory of your Android device.
- Open the menu and select Open weather chart.
Choose the chart from the list. Note that the validity date and time have been saved.
The chart is displayed in the application. If a grib is already loaded, the app automatically selects the validity time of the weather chart .
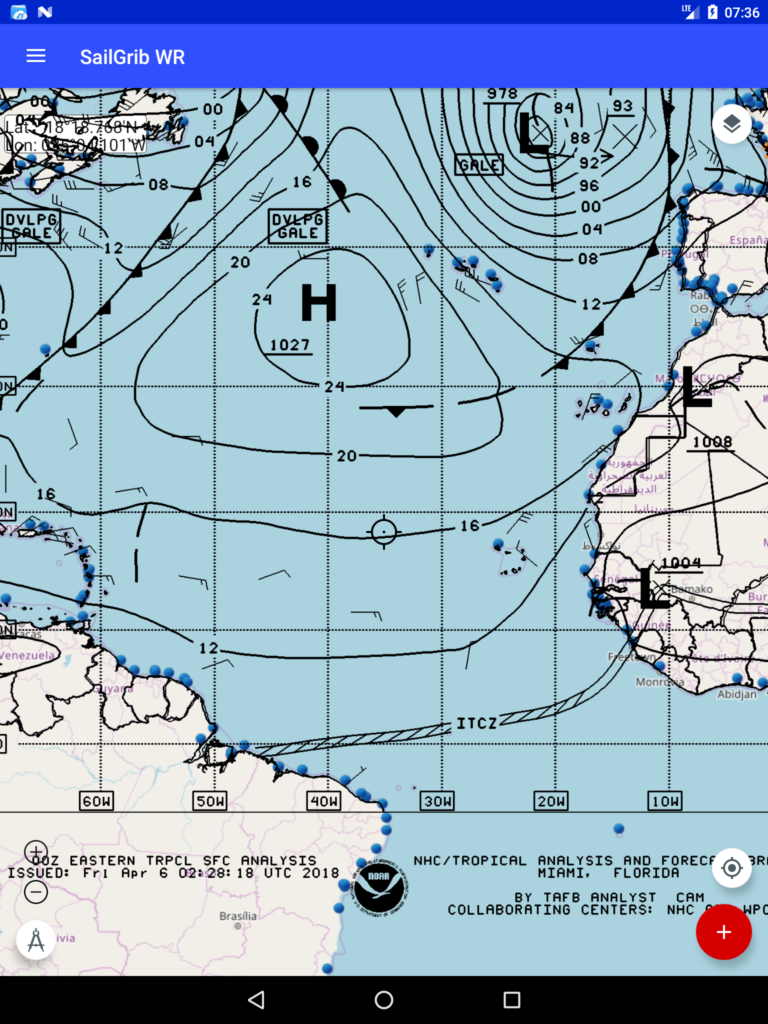
Satellite images, or sat images, used in conjunction with grib files and weather charts help to better understand weather phenomena.
If you want to deepen your knowledge on this subject and speak French, we encourage you to read the excellent book by Jean-Yves Bernot : "Images sat - La météo vue du ciel"
Sat images will be useful for:
- follow the action centers of Highs and Lows...
- to link cloudy phenomena to variations in the surface wind field
- to specify the behavior of certain delicate zones: cold fronts, edges of anticyclones, doldrums...
- visualize local effects.
The downloadable satellite images are derived from geostationary satellite data.
- Their resolution is of the order of 1 km in the visible channel and 3 km for other channels such as infrared.
- The images and their gif animations are updated every hour on our servers.
The following processing is done for each image:
- projection in Web Mercator in order to be able to superimpose them on the application's cartography.
- addition of the coast and border lines, a latitude/longitude grid for better readability
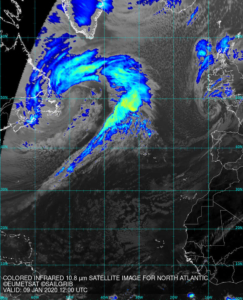
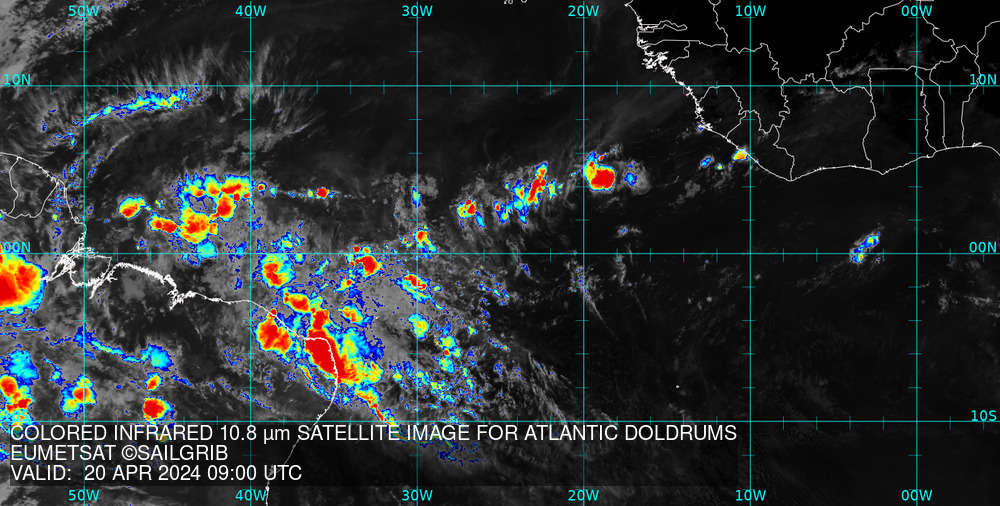
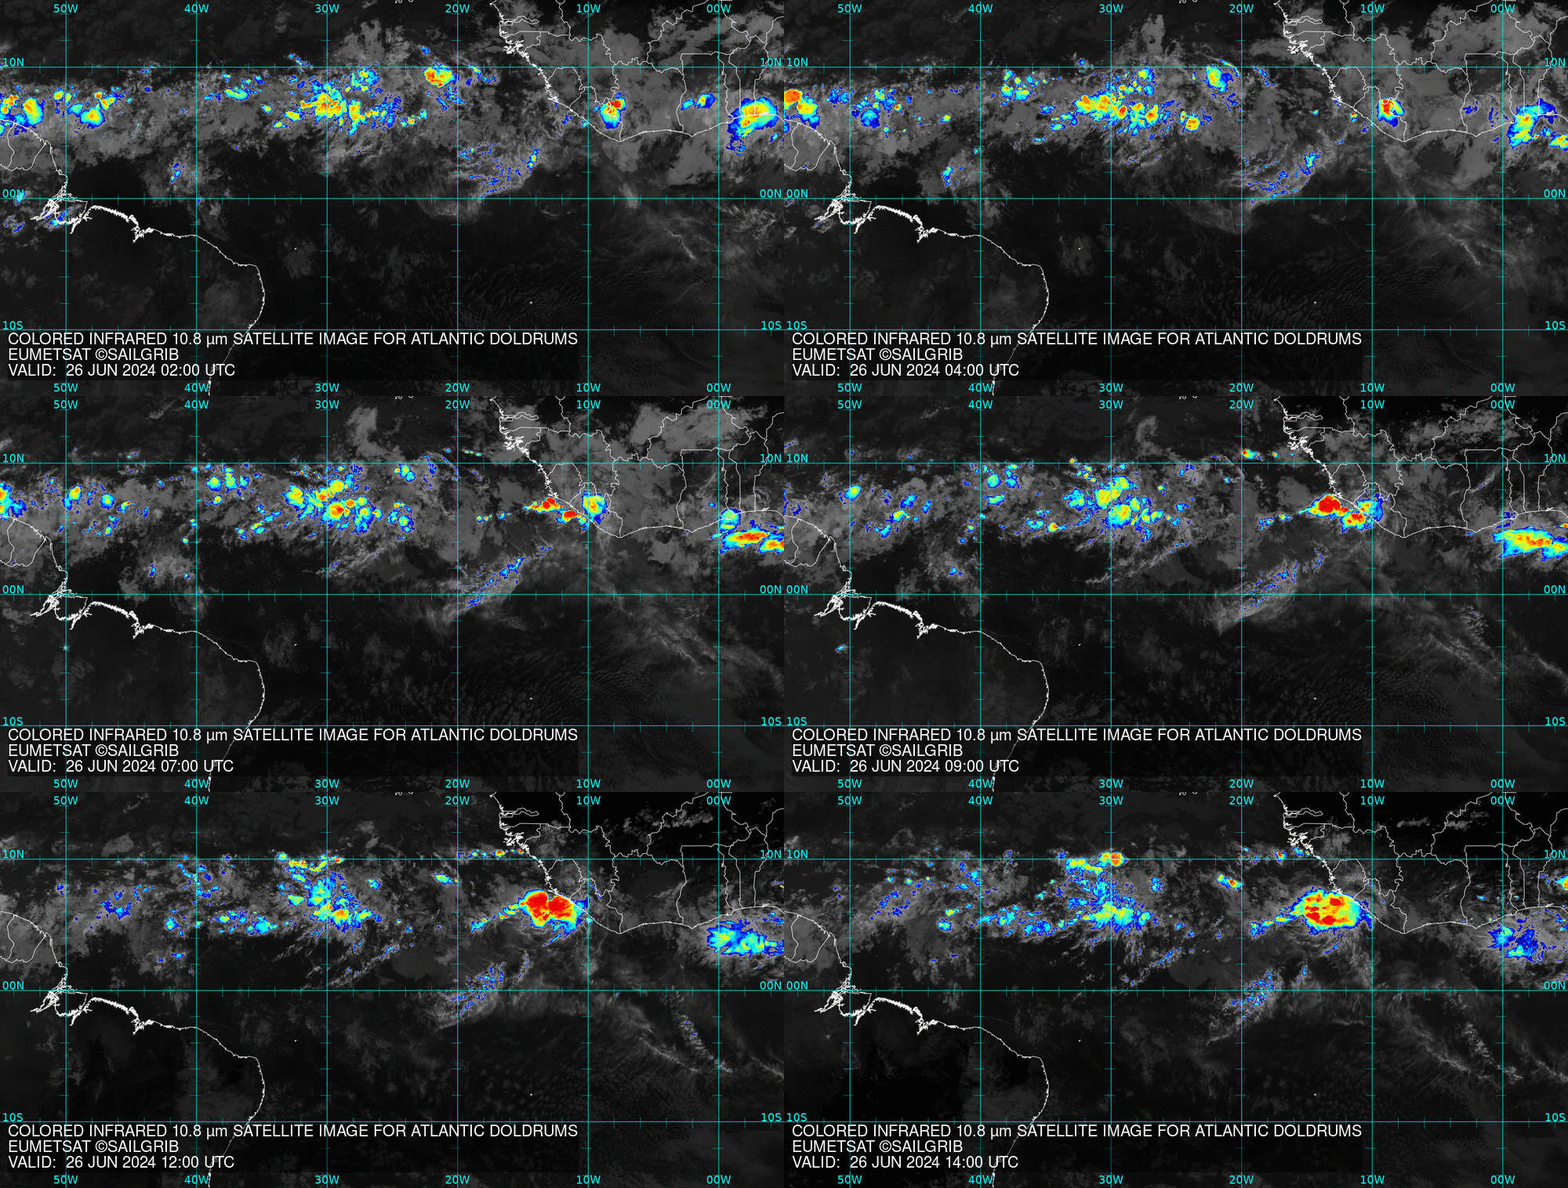
- Colorisation of the images in the infrared to highlight the clouds with the greatest vertical extent and therefore potentially the most active squalls.
- high compression to obtain images which are downloadable with an Irdium Go. The files have a size between 80 and 170 kb and are fit for the app Iridium Go direct download module.
To date, the images come from Eumetsat's Meteosat 0° and 41.5° satellites as well as from NOAA's GOES 16 and GOES 17 satellites. Only the region between 110°E and 160°E is not covered in the application, as the Japanese weather service does not freely distribute the images from the Himawari 8 satellite.
We produce and distribute 4 types of images:
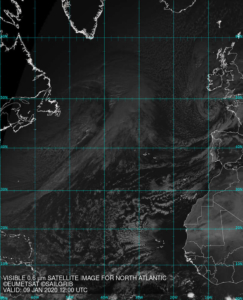
- Visible: to highlight low layer phenomena. Are only useful during the day. The sea is very dark.
- Thermal infrared: the higher the clouds are, the colder they are. Available day and night. Colorized to highlight cyclogenesis.
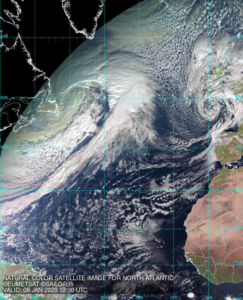
- Natural color: combined from several channels. Eumetsat only.
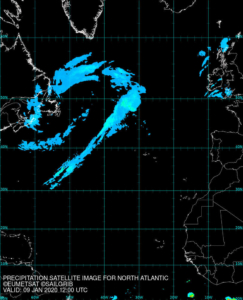
- Precipitation: combined from several channels, gives a snapshot of precipitation, the result is very similar to precipitation radar images. This processing has recently been added by Eumetsat.
In addition, you can also get the Sargassum sat image for the tropical North Atlantic. The image comes from a satellite in low orbit, it gives the concentration of Sargassum. To be used with the notion of slow areas for routing in the app.
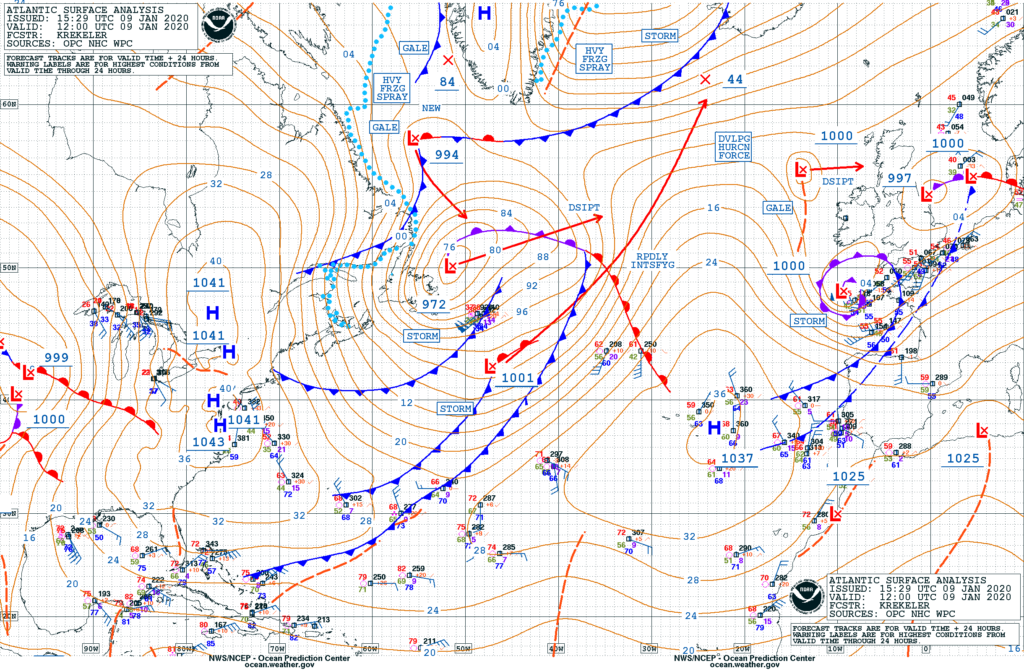
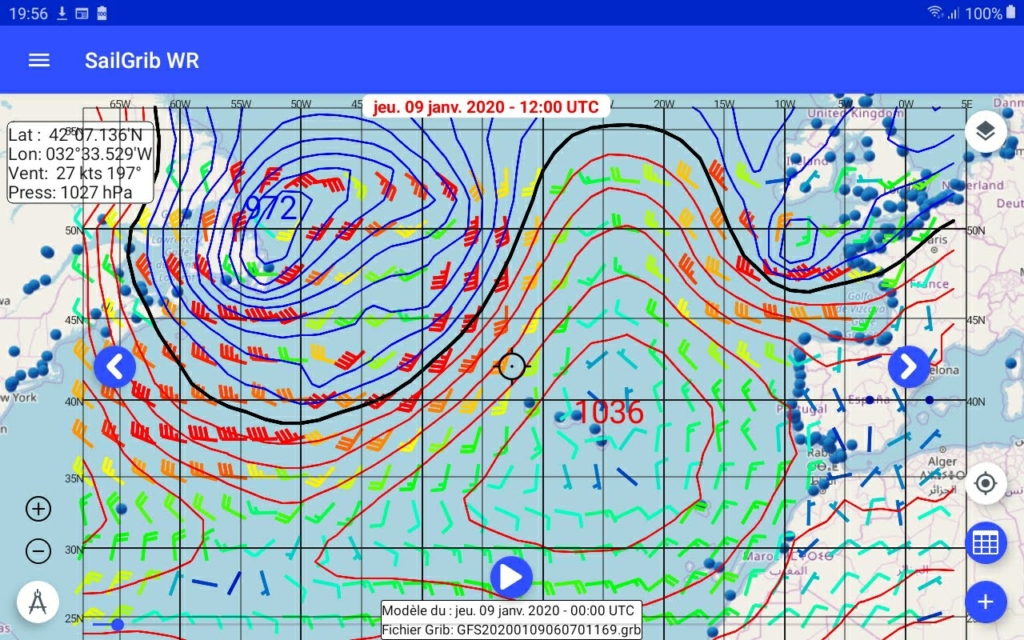
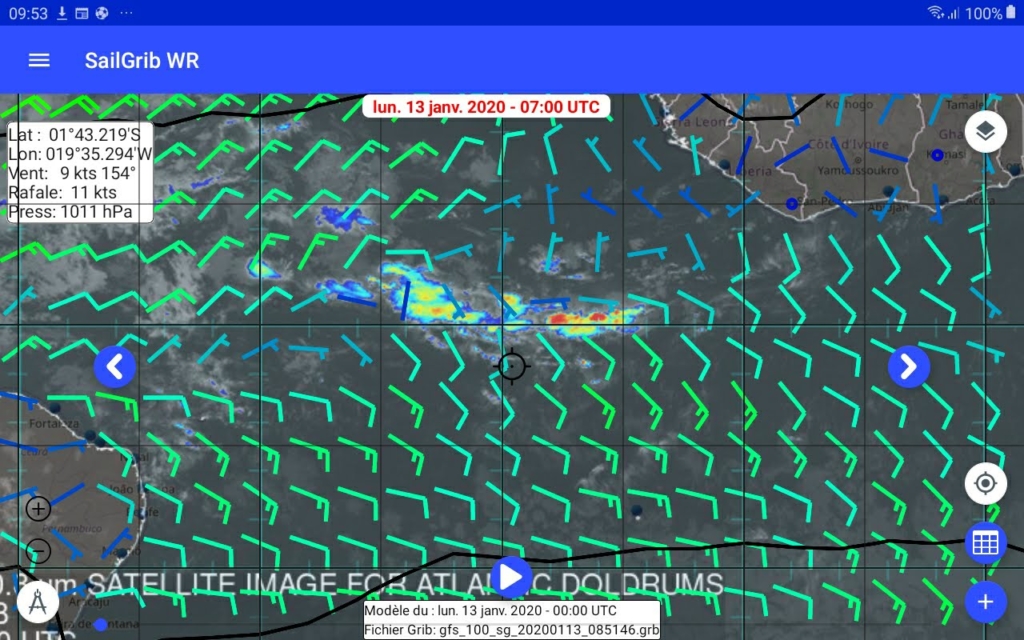
Here are 4 images of the North Atlantic for January 9, 2020 at 12:00TU.
The corresponding surface analysis map.
And the grib file from the GFS model
-
Open the menu
-
Select Get satellite image
- Select from the drop-down menus:
- Zone: Atlantic, Pacific...
- Source: Eumetsat, NOAA
- Image type: Natural color, Visible, Infrared, Precipitation
- Choose:
- Request by Direct download if you are on the Internet or if you are using an Iridium Go while offshore
- Email if you want to make the request by email via SailDocs and an Iridium Go (backup solution)
- Press the Make Satellite image Request button.
The files are very small (100 to 160 kb) and take 1 to 2 seconds to download in WiFi or 4G
It will take from 10 to 15 minutes with an Iridium Go.
- The image is displayed.
- The image is in the Web Mercator projection and can be displayed on the main SailGrib WR map.
The chart must then be synchronized.
As the message indicates, you must match the date and time of validity to the "Valid Date" displayed in the chart inset. Note that the times are always in UTC.
- The image is in the Web Mercator projection and can be displayed on the main SailGrib WR map.
- If you are on the Internet, you can also view an animation of the last 12 hours which will allow you to better understand the evolution of the situation.
- Set the transparency level of the image from 0 for no transparency to 100 for invisible.
-
Press the Open button. The map opens on the main map of the application.
The sat images are saved in the "download" directory of your Android device.
- Open the menu and choose "Open a satellite image".
- Choose the image from the list. Note that the validity date and time have been saved.
- Set the transparency level of the image from 0 for no transparency to 100 for invisible.
- Press the Open button to display the image in the application.
A tide module is included in the application. It calculates the tides in the main harbors of the world without internet connection.
Warning: The tide calculations are not made from official data, the high and low tide times and water heights are approximate and for information only. They can in no way be used as substitute for those provided by official hydrographic services. If you use these data, you acknowledge and accept these limits.
From experience, tide times are accurate within + - 15 minutes and the water height to + - 5% of the tidal range, which is close to variations due to changes in atmospheric pressure.
You can visualize on a map the tides in the different ports of a coast, which should give you a good idea of the tidal wave. Here are for example the water levels in the different harbors of the Channel on 04 April 2018 at 3:17PM. In red the tide is ebbing, in green it is rising.
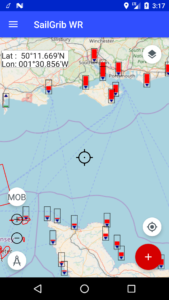
- Pressing a tide icon opens the tide view page in that harbor. A long tap on any point on the map opens the tide view page for the nearest harbor.
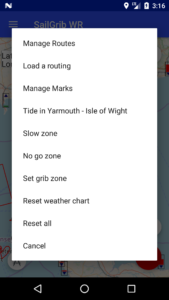
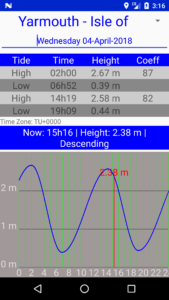
- It is possible to search for a harbor: go to the main menu and select Harbor search.
SailGrib WR now includes tidal current atlases for the European coasts. These atlases were compiled using data provided by the Mercator Ocean models. They cover all the European coasts where tidal currents are the main ones and are therefore relatively predictable. It does exclude currents for the Baltic and the Mediterranean seas. For these two seas, grib files are available.
If you sail in France and you are looking for more precise atlases, you can purchase packs of tidal currents atlases produced by the Shom.
If you want more details on the atlases, the purchasing and activation procedures, get the dedicated help file.
The atlases were compiled at different scales:
- Maximum resolution for areas where tidal currents are important
- Resolution 0.2 ° elsewhere.
The following atlases are included:


Tous ces atlas sont disponibles dans l’application payante. Il faut, dans un premier temps, les initialiser dans l’application. Lors de la première utilisation, l’application vous propose de le faire.
|
Name |
Model |
North Latitude |
South Latitude |
West Longitude |
East Longitude |
d_lat |
d_lon |
|
Gironde Landes HR |
IBI |
46.0° |
44.0° |
-2.0° |
0.5° |
0.03° |
0.03° |
|
La Rochelle Vendee HR |
IBI |
47.6° |
46.0° |
-2.5° |
-1.0° |
0.03° |
0.03° |
|
Bretagne Sud HR |
IBI |
47.8° |
47.1° |
-3.7° |
-2.5° |
0.03° |
0.03° |
|
Bretagne Ouest HR |
IBI |
49.0° |
47.6° |
-5.5° |
-3.7° |
0.03° |
0.03° |
|
Bretagne Nord HR |
IBI |
49.0° |
48.4° |
-3.7° |
-2.9° |
0.03° |
0.03° |
|
Golfe Normand Breton HR |
IBI |
50.0° |
48.4° |
-2.9° |
-1.4° |
0.03° |
0.03° |
|
Baie de Seine HR |
IBI |
50.0° |
49.2° |
-1.4° |
1.0° |
0.03° |
0.03° |
|
Pas de Calais HR |
IBI |
51.5° |
50.6° |
0.8° |
2.5° |
0.03° |
0.03° |
|
West Netherlands HR |
IBI |
52.0° |
51.0° |
2.5° |
4.2° |
0.03° |
0.03° |
|
Solent HR |
IBI |
51.0° |
50.0° |
-3.7° |
-0.7° |
0.03° |
0.03° |
|
Cornwall HR |
IBI |
50.5° |
49.5° |
-6.7° |
-3.7° |
0.03° |
0.03° |
|
Bristol Channel HR |
IBI |
52.0° |
51.0° |
-4.5° |
-2.5° |
0.03° |
0.03° |
|
West Wales HR |
IBI |
52.2° |
51.5° |
-5.5° |
-4.5° |
0.03° |
0.03° |
|
Isle of Man HR |
IBI |
55.5° |
54.0° |
-6.0° |
-4.2° |
0.03° |
0.03° |
|
Gibraltar HR |
IBI |
36.5° |
35.3° |
-6.0° |
-5.0° |
0.03° |
0.03° |
|
UK Ireland 0.2° |
IBI |
56.0° |
51.0° |
-11.0° |
2.0° |
0.20° |
0.20° |
|
Channel 0.2° |
IBI |
51.0° |
48.5° |
-6.0° |
2.0° |
0.20° |
0.20° |
|
Spain 0.2° |
IBI |
44.0° |
40.5° |
-9.5° |
-1.0° |
0.20° |
0.20° |
|
Portugal 0.2° |
IBI |
40.0° |
36.5° |
-10.0° |
-6.5° |
0.20° |
0.20° |
|
Gibraltar LR 0.2° |
IBI |
37.0° |
35.0° |
-7.0° |
-4.0° |
0.20° |
0.20° |
|
West Channel 0.2° |
IBI |
51.0° |
48.5° |
-11.0° |
-6.0° |
0.20° |
0.20° |
|
Gascogne 0.2° |
IBI |
48.5° |
44.0° |
-9.5° |
-1.0° |
0.20° |
0.20° |
|
West North Sea 0.2° |
IBI |
56.0° |
51.0° |
2.0° |
5.0° |
0.20° |
0.20° |
|
East Netherlands HR |
ENWS |
56.0° |
52.0° |
4.6° |
7.0° |
0.07° |
0.11° |
|
German Bight HR |
ENWS |
58.0° |
53.0° |
7.0° |
10.0° |
0.07° |
0.11° |
|
Scotland HR |
ENWS |
59.5° |
55.5° |
-9.0° |
-1.0° |
0.07° |
0.11° |
|
Faroe HR |
ENWS |
63.0° |
61.0° |
-8.0° |
-6.0° |
0.07° |
0.11° |
|
Shetland HR |
ENWS |
61.5° |
59.5° |
-2.5° |
0.0° |
0.07° |
0.11° |
|
North North Sea 0.2° |
ENWS |
63.0° |
55.5° |
-11.0° |
5.0° |
0.20° |
0.20° |
|
East North Sea 0.2° |
ENWS |
63.0° |
52.0° |
5.0° |
10.0° |
0.20° |
0.20° |
To load an atlas:
- go to the Settings menu
- choose Tides and Currents
- press the Load atlases of current button
The loading of atlases is a rather long procedure, it can take a few minutes.
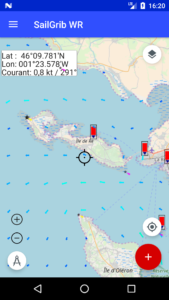
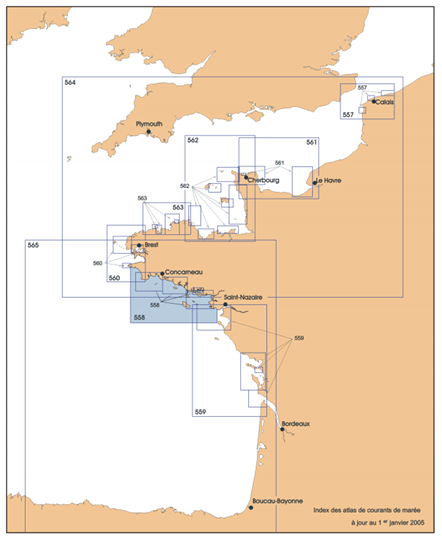
SHOM publishes tidal current atlases for the coasts of metropolitan France, the Channel and the Atlantic. They map the direction and intensity of tidal currents at each "tide" hour relative to a reference harbor. These atlases are developed from two-dimensional numerical models and validated in situ.
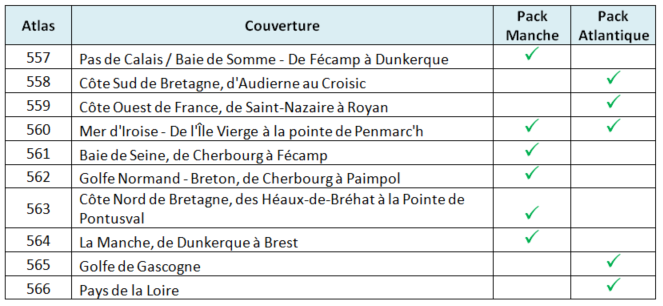
Each atlas can contain different precision zones. For example, Atlas 558 covers the southern coasts of Brittany from Audierne to Croisic. It contains the South Brittany, Glénan, Groix, Quiberon and Morbihan zones.
In sensitive areas like the entrance to the Gulf of Morbihan, these atlases are much more accurate than those provided free in the application.
The atlases are grouped into 2 "packs", one for the Channel and the other for the Atlantic. Each pack is offered at 33€ HT. The price including VAT depends on the country of purchase. It is 39.99€ for a purchase made from France.
If you want more details on these atlases, the purchase and activation procedures, get the dedicated user guide.
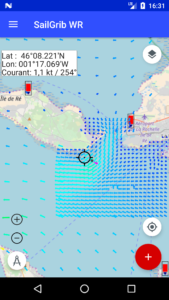
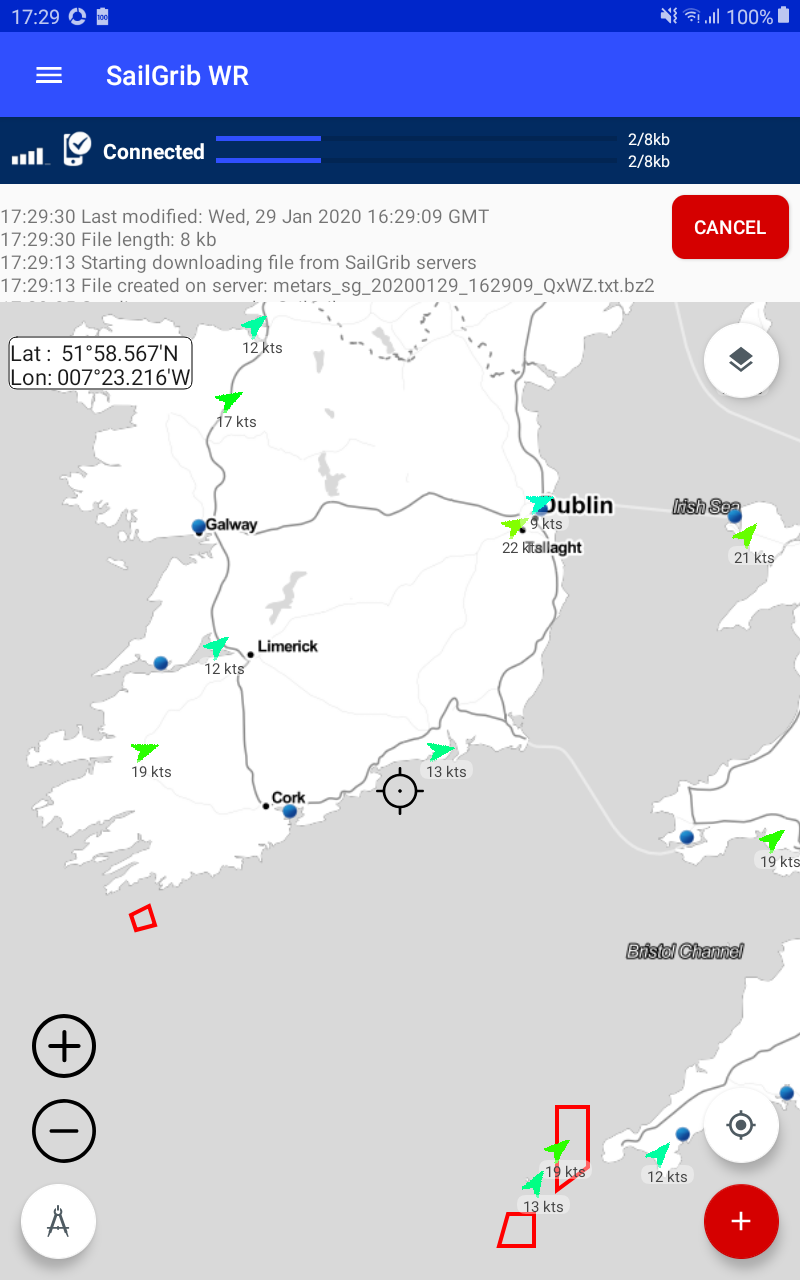
The app displays near real-time data from 2 sources:
- weather buoy readings from several weather services including the NOAA, the Met Office and Météo France.
- airport station readings called METAR,
Weather buoy data is generally updated hourly. For airports, it varies but often in the order of 30 minutes.
If your Android device is connected to the Internet, the download is automatic. At sea, with an Iridium Go, the user can upload small files containing the data for his navigation area.
- Open the main menu
- Check "Weather stations"
Data are automatically downloaded and displayed as arrows.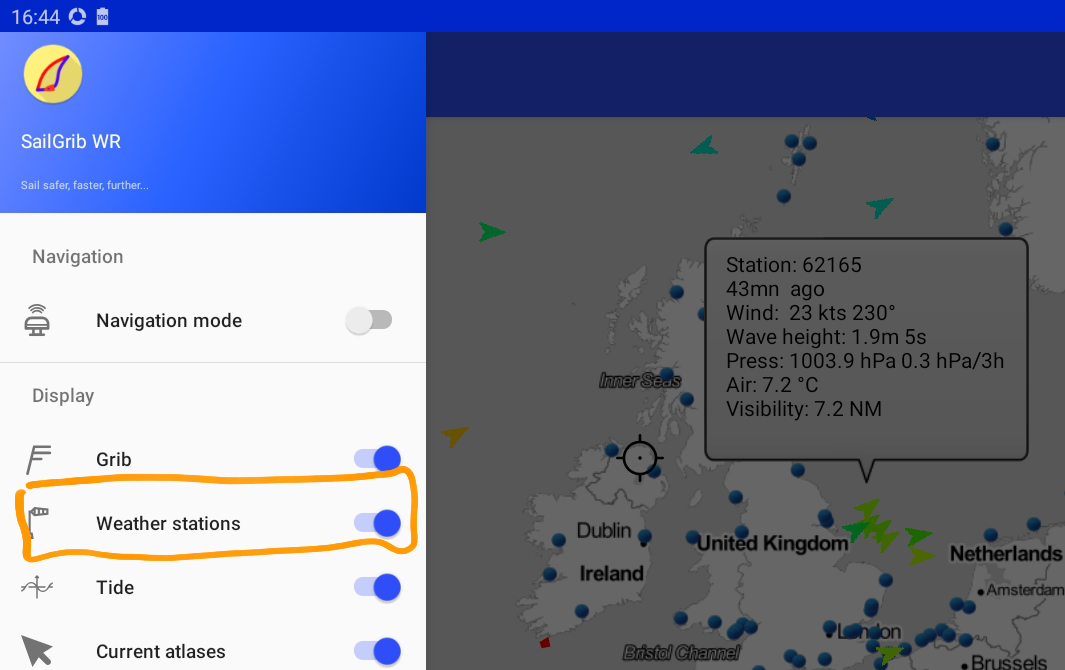
The color of the arrows depends on the wind speed. The gradient is the same as the one used to display the grib files wind barbs. - Tap on a station to view the details of the reading.
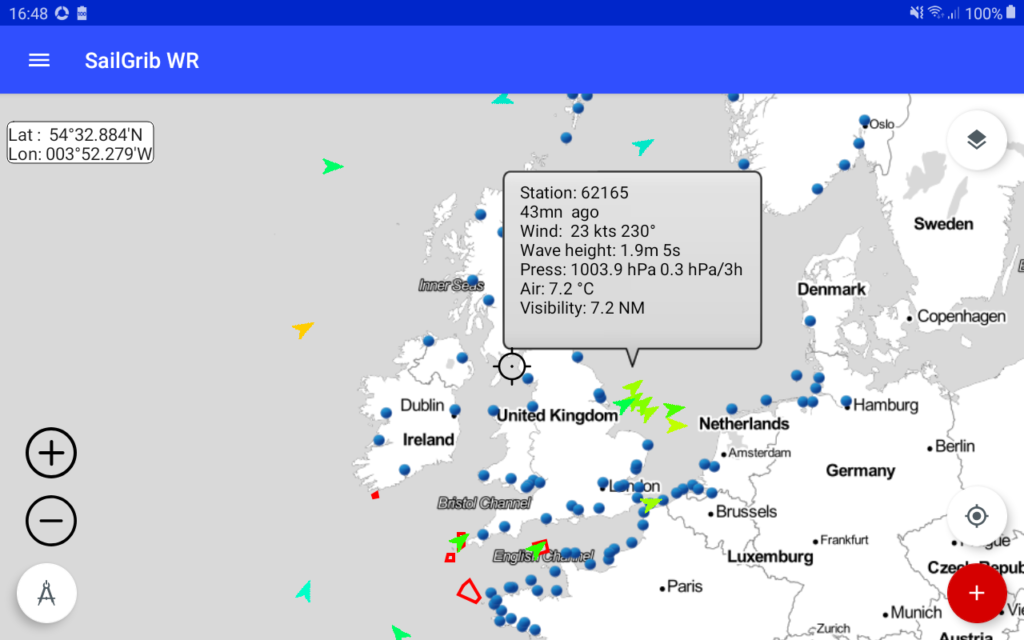
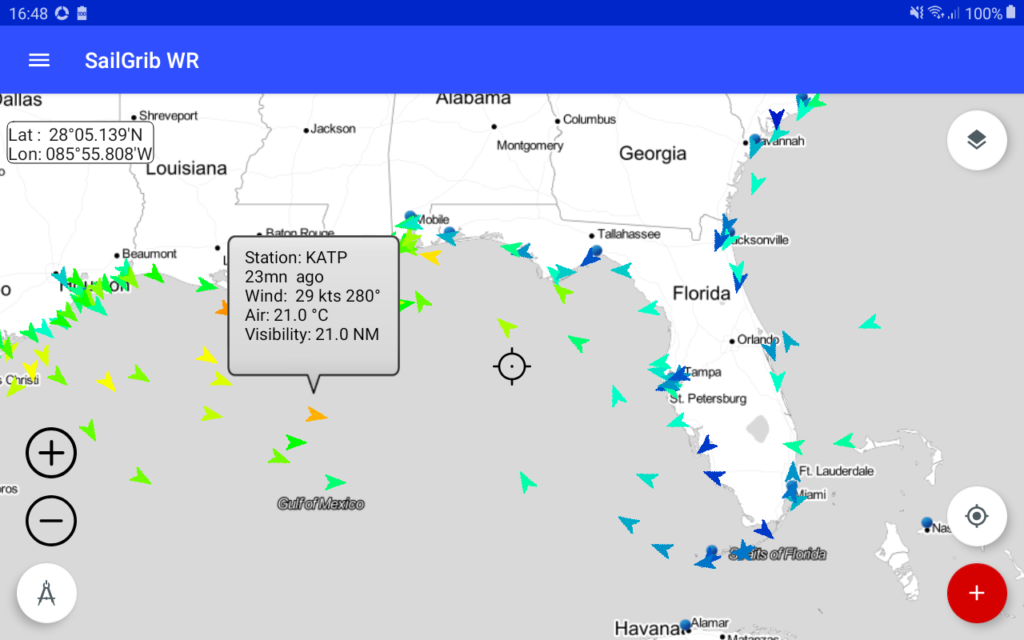
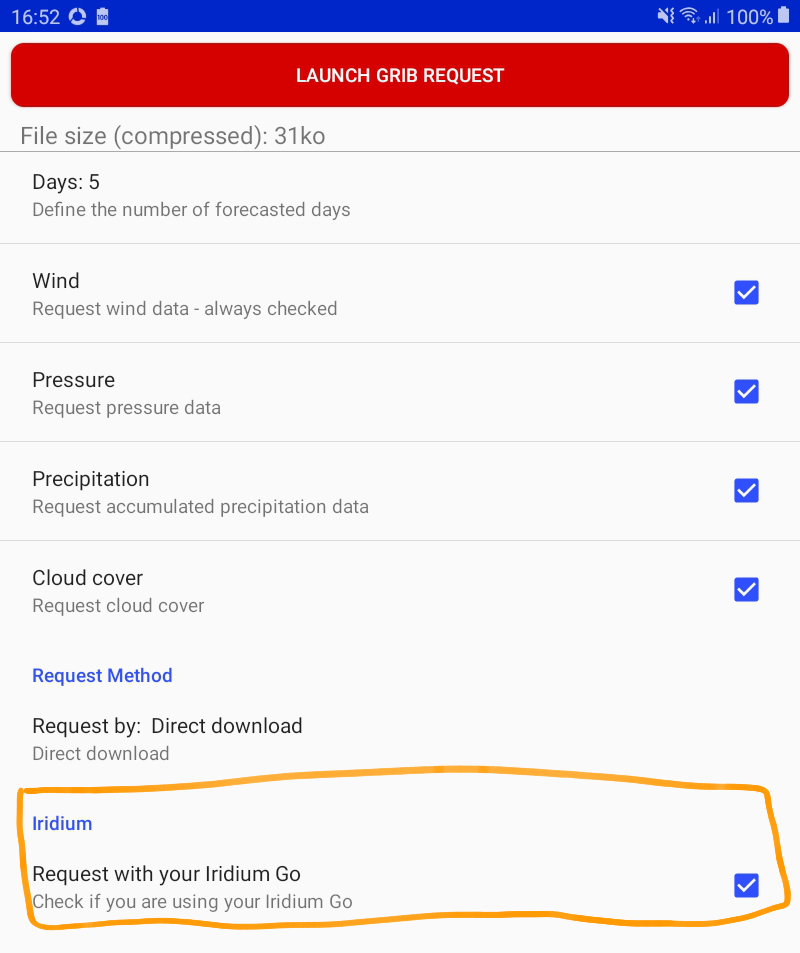
- At the beginning of navigation, check the option Request with your Iridium Go in the grib request menu.
- Center the map
- Open the menu and select Get buoy weather data or Get airport weather data.
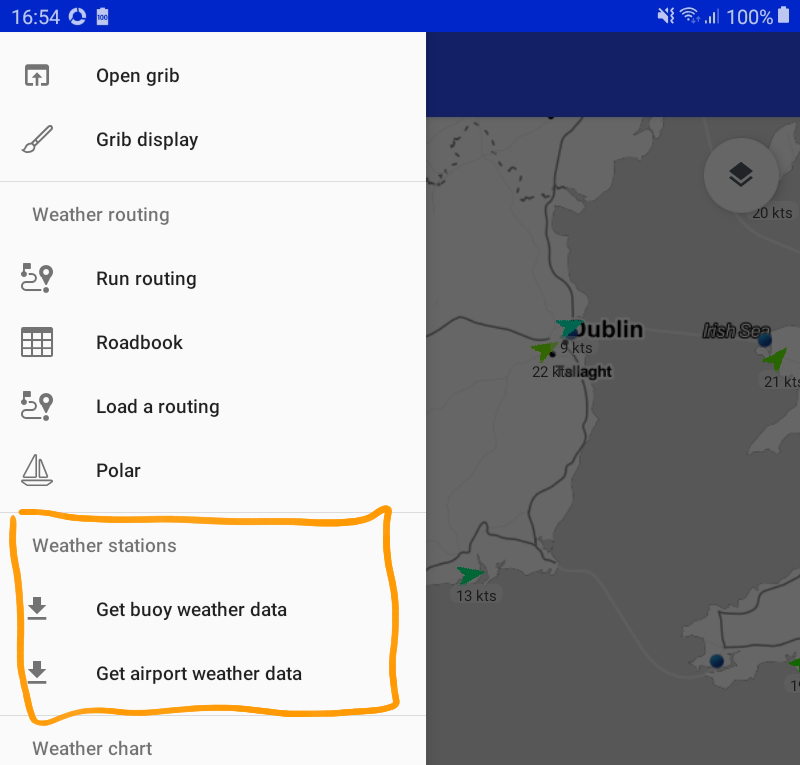
- The query is launched, the file is downloaded and its data is displayed. The files will be very small, in the range of 1 kb to 10 kb and should take one minute to load.
Weather routing is the calculation of the fastest route between 2 waypoints or a succession of waypoints called route taking into account weather forecasts, current forecasts, boat characteristics and certain constraints imposed by the user (maximum wind, sail and engine routing, prohibited areas...)
The application uses the isochrones method to calculate routing. An isochron is a curve representing the points that a sailboat can reach in a given time. You will see these curves drawn during the routing calculation.
The main steps to do a routing are:
- download a grib forecast file including wind
- create a route
- choose the departure time
- choose the boat polar
- if necessary, set the optional parameters
With a little practice, you can calculate your routings less than a minute!
- Create a route
- Press the Action button

- Press the Create a Route button
- Enter a route name
- Press Yes if the route starts at your GPS position
- Long press at the first waypoint position
- Repeat until the end of the route
- Press the Done button
The great circle line (shortest route between 2 waypoints) between each waypoint is drawn, the distance and average heading between each waypoint is displayed in the center of each segment.
Watch a video on YouTube
Note : you can also start with a long press the screen and choose Manage routes / Create a route.
- Press the Action button
- Load a route already created
- Long press the screen and choose Manage routes / Load a route
- The most recent used route is loaded
- Pick the route you want to load in the upper screen drop-down list
- Activate a route by creating or loading it:
- To create it, see the previous help
- To load a route: long press the screen and select Manage routes / Load a route
- Switch to Edit route mode: long press the screen and select Manage routes / Edit route mode
- Move waypoints by hand by dragging them across the screen
- Press the "Finish" button
Watch a video on YouTube
-
Create or load a route.
If a route is already loaded, long press the screen and choose Manage routes / Edit route mode -
Press the "Edit" button
-
Press the waypoint to edit
-
Change the waypoint coordinates or type
- Press the "Ok" button then "Open" to return to the map
Waypoints can be of 3 types :
- "Go through." This is the default type. The boat passes the waypoint and then continues to the next waypoint
- "Leave to starboard." The boat must leave the waypoint to starboard but is not required to pass through the waypoint.
- "Leave to port." The boat must leave the waypoint to port but is not required to pass through the waypoint.
The waypoints "Leave to port" and "Leave to starboard" should be handled with care. In practice, they are only used if the angle of the route before and after this waypoint is very open. If the application finds that the angle is too closed, it will consider that the boat will have to pass through the waypoint.
Note: you can delete a waypoint or route by pressing one of the Delete buttons.
Watch a video on YouTube
SailGrib WR comes with the iPolar module developed by KND for iOS. (Paid version or Premium option only).
KND is a world leader in sailing performance ananlysis with over 15 years of experience in the field of speed prediction programs (VPP) for racing yachts.
We thank Dimitri Nicolopoulos-Salle, founder of KND, for giving us access to the iPolar code.
iPolar computes the performance polars of a given boat as a function of a reduced set of parameters:
- Length Overall (LOA)
- Waterline Length (LWL) if unknown, iPolar will make the assumption that LWL is 95% of LOA
- Displacement
- MainSail Area
- Jib Area
- Symmetrical spinnaker area (optional)
- Asymmetrical spinnaker area(optional)
Limitations of iPolar:
- Currently only handles monohulls
- LOA ranging from 8 to 20m
Accuracy:
iPolar is a very simple Velocity Prediction Program (VPP) which predicts the polars of a boat based on a very limited range of parameters: length, displacement and sail area .
This simplicity implies some restrictions : iPolar is meant to predict reasonably accurately polars for production cruisers and cruiser racers - it is currently limited to mono-hulls.
For boats significantly outside of the iPolar parameter range and for racing polars accuracy, the use of more complex VPP tools is required. KND-SailingPerformance uses the NorthSails VPP, developed through several cycles of America's Cup, relying for each boat on the generation of a large matrix of hydrodynamic forces (through Computational Fluid Dynamics or CFD methods) and advanced sails models. In case you would be interested in such a VPP for your yacht, contact us directly.
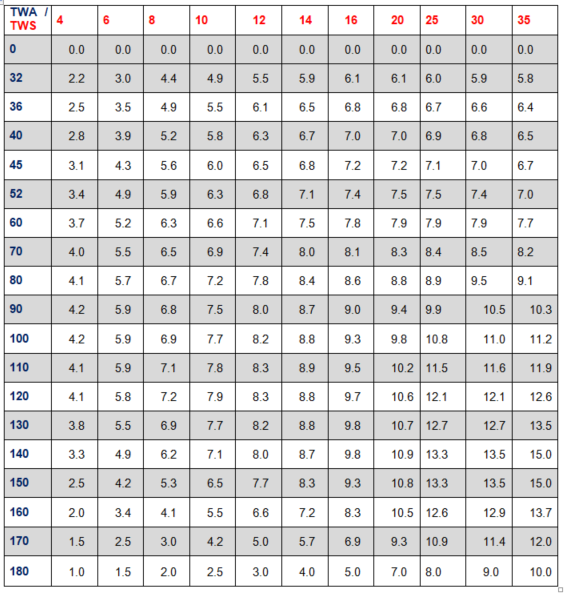
Polar curves represent the boat speed for a given wind speed and angle : SOG = fpolar(TWS, TWA).
SailGrib WR uses the same polar format as Maxsea or Adrena. A polar file is a tab delimited text file where each line represents the boat speeds for a given true wind angle and each column represents a wind speed.
To avoid problems, the boat speeds can be formatted with “.” or “,” as decimal separators.
It is better if a polar file has a line for 0° and 180° and columns start with a wind speed of 0 knot.
Here are the rules if SailGrib does not have a value for a particular wind speed and angle:
- If the wind speed is greater than the highest wind speed value in the polar file, SailGrib WR will take the value corresponding to that highest wind speed.
- If the wind speed is lower than the lowest wind speed value in the polar file, SailGrib WR will interpolate between 0 and the value corresponding to that lowest wind speed.
- If the wind angle is higher than the highest wind angle value in the polar file, SailGrib WR will use the value corresponding to that highest wind angle.
- If the wind angle is lower than the lowest wind angle value in the polar file, SailGrib WR will use a 0 value for the boat speed.
It is highly recommended to include high wind speeds in the polar file and to have low boat speeds for these high wind speeds.
Just for illustration, a simple example of a polar lacking the high wind speed values would be:
SailGrib WR comes with a set of polar files that we have compiled from different sources like boat builders, naval architects or ORC certificates. They should be considered as a starting point for your specific boat and you should adjust them accordingly.
All of them are under the same format with boat speed values for TWA (true wind angle) equals to 0°, 5°, 10°, 15°, 20°, 25°, 32°, 36°, 40°, 45°, 52°, 60°, 70°, 80°, 90°, 100°, 110°, 120°, 130°, 140°, 150°, 160°, 170° and 180° and TWS (true wind speed) values for 0, 4, 6, 8, 10, 12, 14, 16, 20, 25, 30, 35, 40, 45, 50, 55 and 60 knots.
We keep adding polars to the app: more than 400 polars are already in our database.
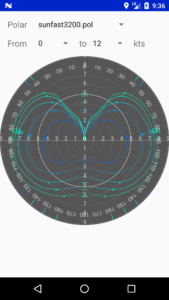
To view a polar:
- open the menu then in the routing section press the Polar button
- Choose the polar to view
- Choose the wind speeds to view
There is no tool in SailGrib WR to edit a boat polar.
Most often, the app is used on a cell phone and it is not a convenient device to edit a large table.
You have 2 options though!
- Use polar efficiencies in the routing menu. This is very easy and efficient.
We have implemented 2 polar efficiency parameters, one for winds under 10 knots and a second one for winds over 20 knots. SailGrib interpolates for wind speeds in between. As most polars are theoretical ones, we recommend to set these parameters to around 85% for cruising boats with a clean hull, not overloaded and with decent sails. - Use the editing tools we have published on our website:
- an Excel sheet
- a Windows program written by Ralph Lechterbeck - Thanks 🙂
A SailChart in SailGrib WR is a table that indicates the optimal sail for a given wind speed (TWS) and wind angle (TWA).
The optimum sail is then displayed in:
- weather routings
- the measuring tool to determine, for example, the best sail on the next leg
- the quick measuring tool
The table representing the SailChart is saved in a text file with a .sail extension whose data is separated by tabs.
The first line starts with ![]() and continues with a list of true wind speeds (TWS)
and continues with a list of true wind speeds (TWS)
The following lines start with a true wind angle (TWA) and continue with the list of optimal sails for this TWA
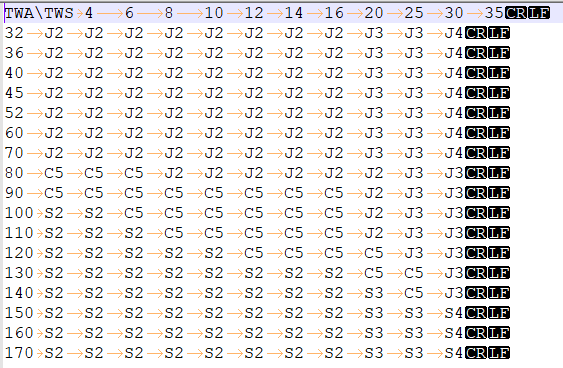
It is relatively easy to modify a SailChart using a text editor.
We have made an Excel sheet that allows you to create your own SailChart.
You can download it here.
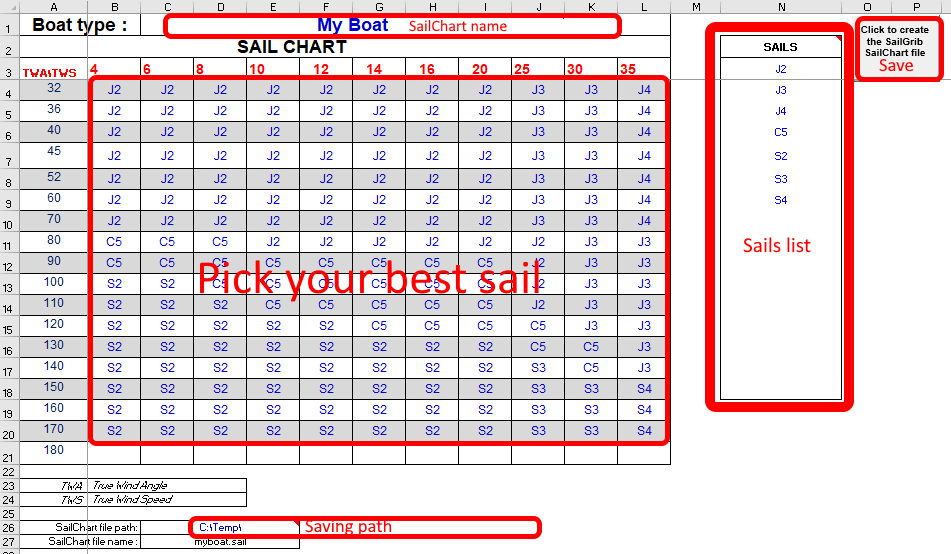
1/ Create a SailChart
The font color of the cells to be filled is navy blue
- Enter the list of your headsails or spinnakers in the blue range[N3:N18].
The sail in the cell 45°/10 knots represents the optimal sail from 45° of TWA and 10 knots of TWS.
- Choose the optimal sail for each cell in the range[B4:L21].
- Enter the name of the sailchart in cell[C1].
- Enter the directory where the sailchart will be saved in cell[C26].
- Click on the[Click to create the SailGrib SailChart] button
2/Activate the SailChart in SailGrib WR
- Send you by email the SailChart file you just created
- On your Android device, open the email and save the attachment
- SailGrib WR will automatically copy it on your device into the sailgrib directory, under the sailchart subdirectory
- Select the SailChart from the Routing menu
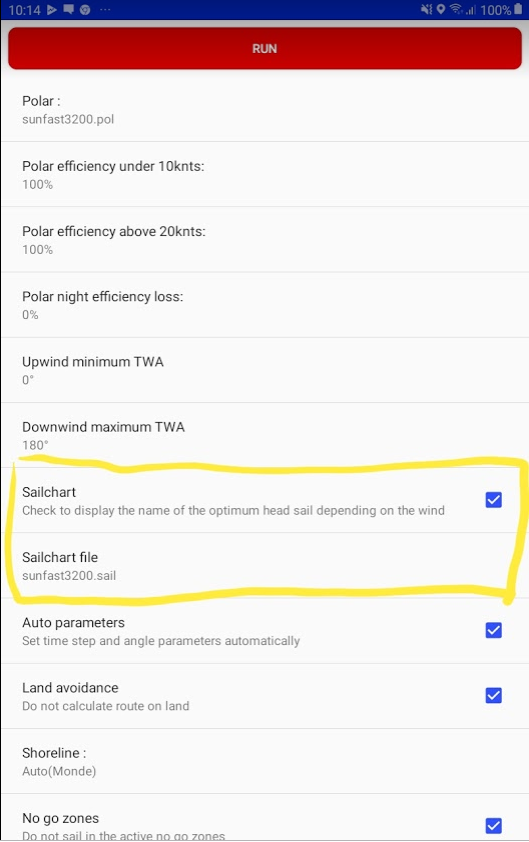
- In the routing menu, check SailChart and choose your SailChart
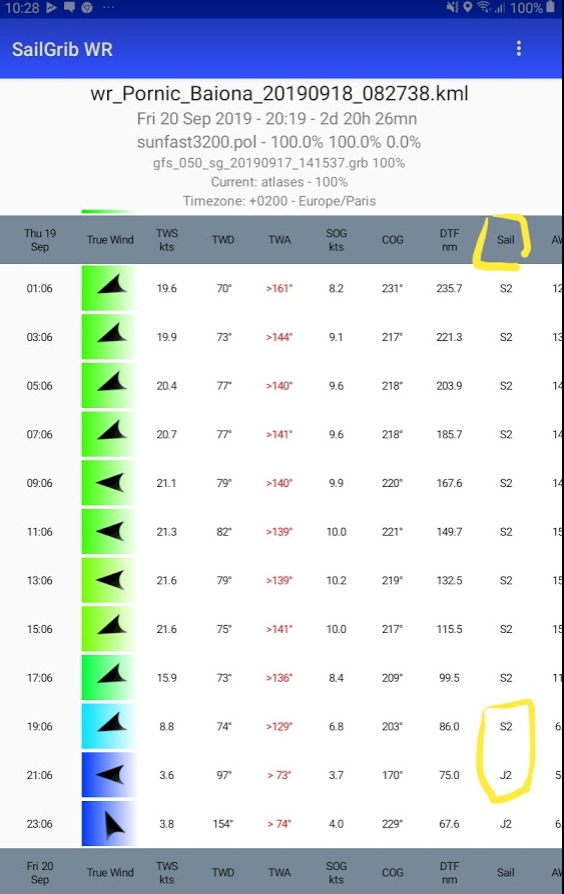
- Run the routing
- Press the blue button on the Running Table at the bottom right of the screen
- The best sail is displayed on each line of the roadbook.
This function uses the instantaneous wind measurement (TWD and TWA) from the NMEA flow.
The SailChart used is the one selected in the routing menu.
Activate the dry point compass, the best sail is displayed in the information bubble.
This function is convenient to anticipate the sail to be used on the next leg.
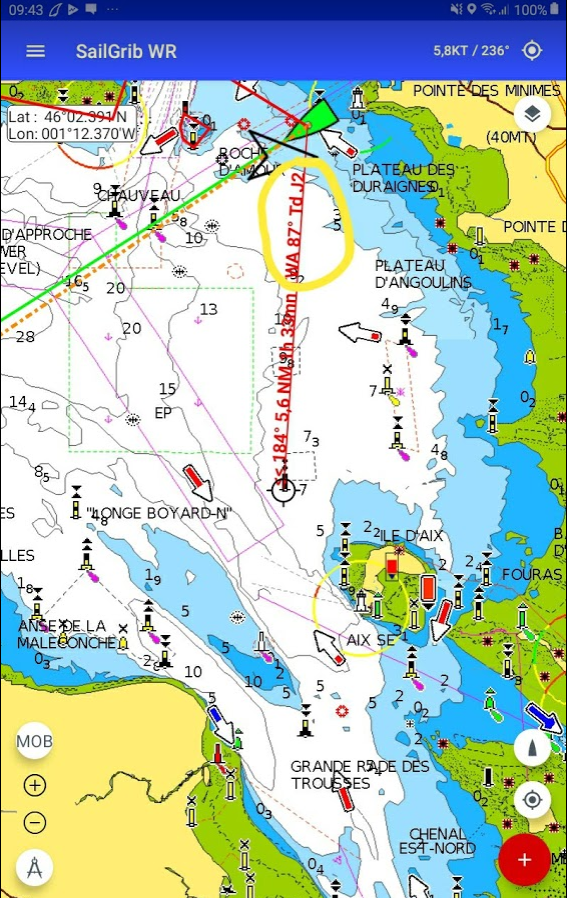
In the example below, I am upwind towards the buoy "Roche du Sud".
What will be our speed and the sail to use on the next leg between "Roche du Sud" and Aix NW?
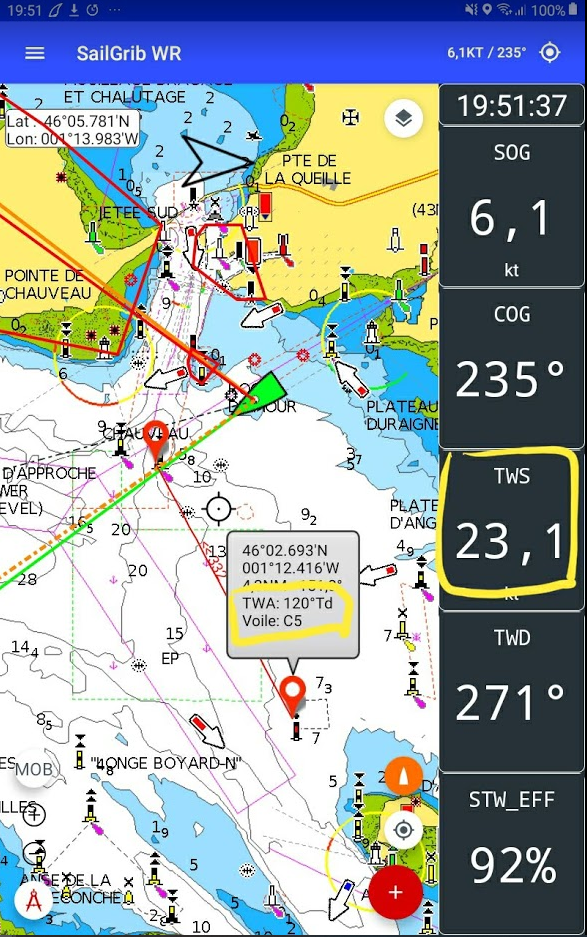
We will be on starboard tack with a 120° true wind angle, under Code 5
This function uses the instantaneous wind measurement (TWD and TWA) from the NMEA flow.
The SailChart used is the one selected in the routing menu.
If the option "Boat to map center line" is checked in the Settings > GPS NMEA AIS menu, the distance, heading, TWA and optimal sail indications are displayed.
In this example, if we hit the AIXNW buoy located at 5.6Nm in the 184°, we will besailing with a 87° TWA and the optimal sail will be our J2.
Even if we have, for example, a 10 day grib file, we often want to limit the routing to 4 to 5 days where the weather forecast quality is good.
It might be helpful to calculate a routing using 2 wind grib files.
- when using files with fixed coverage (Open WRF)
- while racing if you want a finer file for a specific area and you upload your files by iridium. For example, take a HR file if you sail off Cape Finisterre. For crossing the Atlantic, it is interesting to take a global file has large grid and a local file with a finer grid.
The application will choose at each point the file which grid is finer.
As a first adjustment step, we have implemented 2 polar efficiency parameters, one for winds under 10 knots and a second one for winds over 20 knots. SailGrib interpolates for wind speeds in between.
As most polars are theoretical ones, we recommend to set these parameters to around 85% for cruising boats with a clean hull, not overloaded and with decent sails.
While cruising, you most often decrease your performance at night: no spinnaker, safety reef, etc… enter 10% and the polar efficiency speed will be decreased by 10% on top of the low and high wind efficiency parameters.
For example, if you have a 80% low wind parameter and a 10% night efficiency loss. Your overall efficiency at night will be 70%. SailGrib automatically calculates the sunrise and sunset times depending on the position of the boat during the weather routing algorithm.
Par défaut, l’option « paramètres Auto » est sélectionnée, elle devrait vous donner satisfaction dans la plupart des cas. L'application calcule des valeurs raisonnables pour le pas de temps entre les isochrones, l'angle de balayage global et le pas angulaire. Si vous décochez l'option « Paramètres Auto », vous pouvez spécifier chaque paramètre individuellement :
- Pas de temps en minutes : temps fixe entre 2 isochrones
- Angle de balayage : angle entre les segments extérieurs d'une isochrones : valeur entre 10° et 180°.
- Pas angulaire : pas angulaire entre chaque recherche de route : valeur entre 1° et 10°.
Ainsi, si vous avez un angle de balayage de 120 ° et un pas angulaire de 3°, SailGrib calcule 120/3 = 40 routes à partir de chaque point sélectionné sur l’isochrone précédent.
SailGrib displays OpenStreetMap raster maps tiles which do not contain information on whether a point is on land or at sea. SailGrib uses a coastline file to calculate if a point is at sea or inland. These calculations are quite heavy. The more detailed the coastline file, the longer the calculations.
We have implemented several coastline files:
- a rough worldwide coastline that should work fine for most passages. It does not contain all islands or peninsulas (Porquerolles, Ile de Ré, Quiberon, ...)
- more detailed regional coastline : Europe, the Caribbean, North America, South America, Western Pacific, Eastern Pacific, Oceania, Asia, Africa, which should be sufficient in the vast majority of cases.
- even more detailed local coastlines for specific sailing areas : Mediterranean Sea, Atlantic Coast of Europe, France Atlantic and Mediterranean coasts, the US East coast and the US West coast.
- a coastline file for the US Great Lakes
Using the more detailed coastlines affect the performance of the app. We have implemented an “Auto” option which chooses for you which file to use depending on the routing parameters. The app will choose between the world coastline, the regional ones or the local ones. Of course, you can choose a specific coastline file as well.
For long offshore passages, you can speed up the calculations even more by setting the Land avoidance flag to false. This is useful for example for a transatlantic passage.
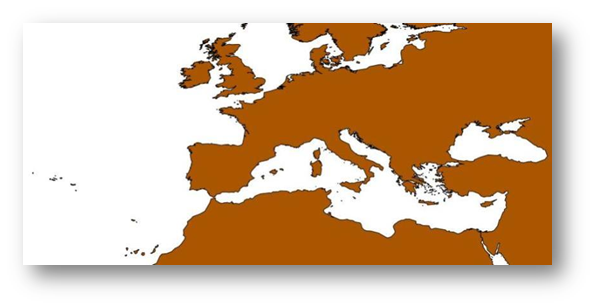
Here is the coastline approximation for Europe using the worldwide coastline.
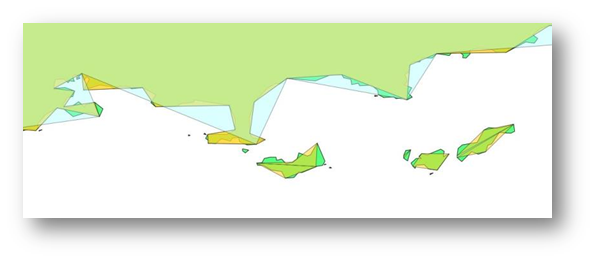
And a more detailed view of the French coastline close to Toulon with a comparison of the worldwide coastline, the regional one (Europe) and the local one.
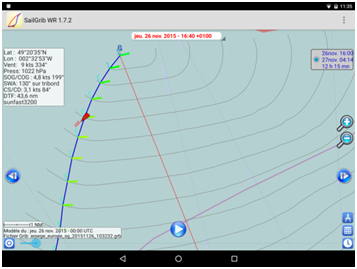
SailGrib WR takes into account all the effects of the current on your boat course:
- drift in current
- change in wind speed and direction
An arrow displays the current strength and direction at each timestep.
The boat icon is rotated according to the Course Through Water the boat has to follow.
The true wind speed and directions (from the grib file) are displayed on the screen.
The Surface Wind Angle is displayed.
You have the choice between 3 sources of current:
- Atlases of currents: for the European coasts. It is by far the easiest to use! SailGrib WR is, as of today, the only app or software to offer such an option for no additional price.
- Grib of currents: they cover the same European coasts for the tidal ones and the entire globe for oceanic ones like the Gulf Stream.
Constant currents: if neither of the former option work and you know that you will sail with a current.
If you want to force SailGrib to avoid areas with heavy or light winds, you can specify here upwind (TWA <=90°) and downwind (TWA>90°) wind limits. Note that by setting these limits, you create discontinuities in the routing and you might end up with no route…
For example, let us say you want to sail on a first 31.7 from Sardigna to Marseille and leave Sardigna on March 13th at 09:00 UTC. If you do not set any wind limit, the duration of the trip should be around 1 day 14hours and the max wind speed on the best route will be 33 knots. If you set a max upwind wind speed of 30 knots, the best route is more to the east, the duration is around 1 day 15 hours and the max wind speed 23 knots. It appears to be a better option (but may be, you should just wait for a day…).
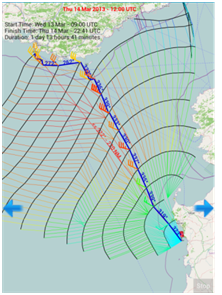
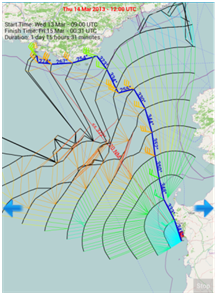
While cruising, for comfort reason, you are often ready to sail upwind slower but with less heal. In other words, you are ready not to sail at the best upwind VMG to preserve your crew. The upwind wind angle limit has been added for that reason. Say, you do not want to sail upwind closer than 55° of the wind direction, simply enter 55 for that parameter. As most polar curves are pretty flat close to the best VMG, you might be surprised by the small additional time your passage might take compared with the gain in comfort.
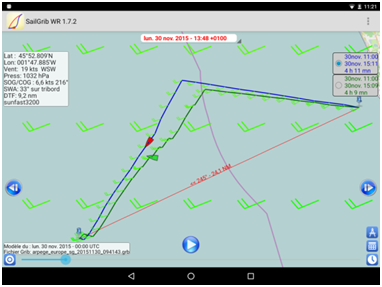
Here is an example of a passage from Les Sables d’Olonne to A Coruña on a Sun Fast 3200 where roughly half of the passage is against the wind.

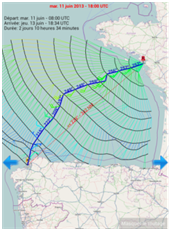
No limit
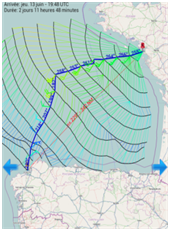
45° limit
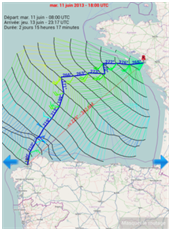
55° limit
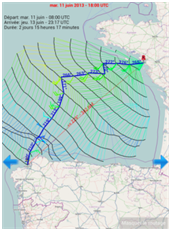
65° limit
You can force the wind speed and direction to constant values.
This can be used for testing purpose or to analyse the effect of current only on a routing.
This option is very useful if you are cruising and want to motor when you are too slow. You can set up the sailing speed over ground limit under which you want to start your engine and the motoring speed when started.
To highlight those isochrones where the boat is motoring, we draw the best route with a dotted line.
Here is an example for a planned trip between Malta and Sicilia on March 28, 2013 on a first 31.7. It takes more than 54 hours if you sail all along. If you decide to motor at 7 knots when your speed is less than 4 knots, then the trip lasts around 48 hours and you motor for 18 hours. Is it worth it?
Note that when the boat is powered, she does not necessarily go straight towards the finish point. She can go for the wind by extending the route.
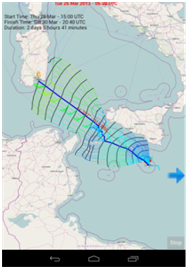
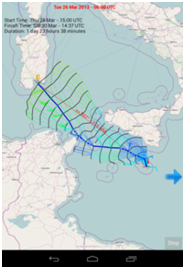
You can apply a tack or gybe penalty to add some more precision and to avoid very short legs. By default, the penalty is 50% of boat speed during 2 minutes.
In the below example, we apply a penalty to the blue routing.
Selected by default, this option allows a tack or a jibe within each isochrone. The boat can sail into the wind and downwind with 2 legs per isochrone.
Few routing software offer this option which is very effective.
It has a drawback while cruising as it often offer to sail very short legs and tack or jibe frequently.
If you uncheck, routing will be a bit slower but with fewer tacks or jibes.
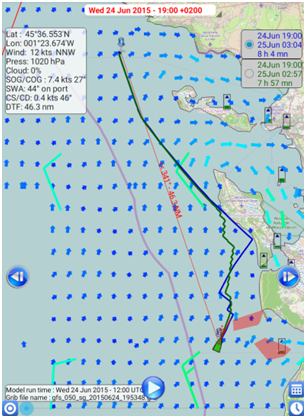
Here is an illustration for a route off the islands of Oléron and Ré:
- in green, a routing where tacks are allowed during an isochronous for a total of 28 tacks;
- in blue, without tacks within an isochrone in, for a total of 8 tacks.
The difference in time is only 4 minutes for an 8 hour sailing trip...
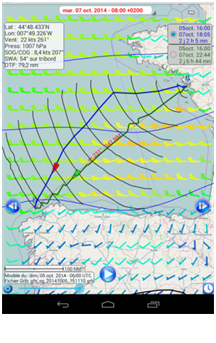
If you select this option, SailGrib will calculate the sailing time along the great circle line. If the great circle intersects the earth, the routing will stop. This option helps assessing the risk of the proposed isochrones routing. If you save 5 minutes on a crossing of the Bay of Biscay sailing far away from the great circle line, it does not seem a good option.
In the following example, the gain following the isochrones routing is in the order of 4:40 minutes over fifty hours, the weather situation seems clear, the isochrones routing seems to be the best option.
If you select this option, SailGrib will create a GPX file of the calculated routing. The file is saved by default in the sailgrib/gpx directory of your SD card or internal memory. You can choose the directory in which this file is saved.
This file can be downloaded to most GPS and OpenCPN. Be careful, SailGrib WR is only a planning tool for your navigation, some points of the route can be on land as the shoreline might not be precise enough.
If you select this option, SailGrib will create an Excel file of the calculated routing. The file is saved by default in the sailgrib/excel directory of your SD card or internal memory. You can change the directory in which this file is saved.
This file can be opened on Android devices with the free Google Sheets app or the free Microsoft Excel app.
The Excel file includes 2 sheets:
- A summary
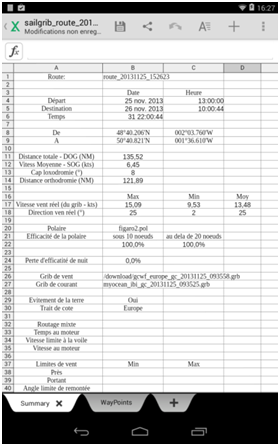
- details of waypoints and different routing settings
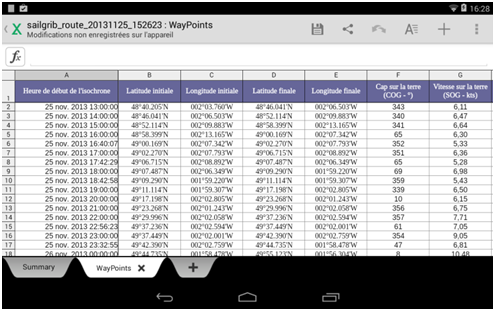
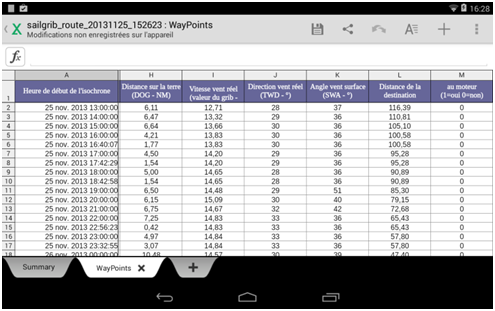
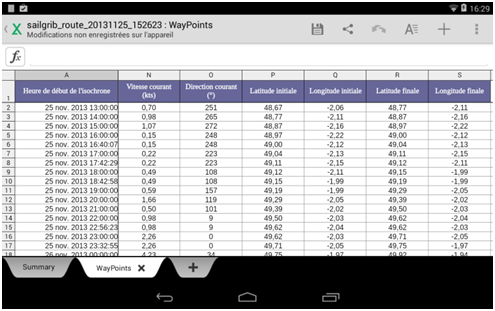
You have loaded a wind grib file and defined your route, all you have to do is choose the departure time and the boat type.
- Press the Action button
 then the Weather Routing button (or open the menu and choose Routing)
 - Only if you are at sea check the option Start now at my position. The application will use GPS to move the starting waypoint and set the start time.
- Otherwise, choose the departure date and time. By default the time is in the local time zone of the phone. You can change the time to UTC in the Preferences menu.
- Choose the polar closest to your boat from the list of more than 400 polars we have created.
- Modify the 2 polar efficiency parameters if necessary. Polars are most often theoretical. For a clean cruise ship who is not too heavily loaded, we generally take around 80% of the theoretical polar.
- Leave all other settings at their default values.
- Press the Run button
Watch a video on YouTube
SailGrib saves routings as KML files (Google Maps). It is possible to load several routings in order to compare them.
You can use this feature to compare routings with different:
- weather models
- polar efficiencies
- polars
- max routing days
- routes
- ...
for exemple: a first routing is done without specifying an intermediate point.
The navigator wants to know what the routing would look like if you forced the boat through a point. It is very simple to do:
- Calculate the first routing
- Insert a waypoint on the route
- Calculate the new routing
You can switch from one routing to the other with the buttons at the top right of the screen. The last calculated routing will always be at the top of the list, the track color will be blue and the boat red.
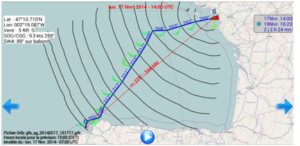
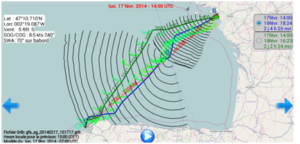
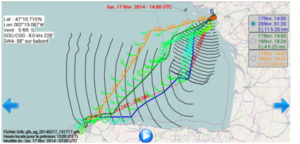
In the example below: route from Saint Nazaire to La Corogne on February 17 on a Sun Fast 3200.
The first routing indicates to go to port in the SW direction then to turn when the wind starts its shift to W. The duration is 2 days 2 hours 24 minutes.
If you force a mid-point on the great circle, the time increases to 2d 4h 25mn. If we move this point towards the interior of the Bay of Biscay, the planned sailing time increases to 2d 11h 20mn.
SailGrib saves routings as KML files (Google Maps). It is possible to load several routings in order to compare them.
You have 2 possibilities to open the list of available routings:
- Long press the screen and select Load Routing.
- Open the menu, go to the weather routing section and press Load a routing.
Then choose the routings to load from the list of all saved routings and press the Load button.
- Shoreline : draw the shoreline used for the routing
- Best route windbarbs: draw the forecasted wind at the time of the routing for the best route point.
- Best route current arrows: draw the forecasted current at the time of the routing for the best route point.
- Best route courses over ground: display the true COG between 2 points. Note that depending on the scale of the map, the course might be hidden.
- Isochrones: display the isochrones in grey.
- Isochrones pivot points: display the pivot points in grey.
- Isochrones segments: display the isochrones segments. The color of the segment depends on the true wind speed at the start of the isochrones for each point. This will give you an idea of the wind speed on the different parts of the sea at the isochrones time.
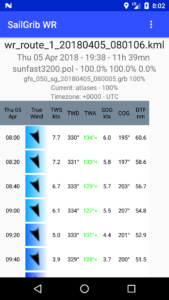
ou can display 2 types of roadbooks:
- Directly on the screen: press the button to obtain a synthetic view of the selected routing.
-
In the menu, go down to the Weather routing section, press the Roadbook button.
-
The first tab displays global data and some routing statistics:
-
Finish time, duration, start time
-
Finish and start coordinates
-
Distance of the route and average speed over ground
-
Rhumb line bearing, great circle line distance and comparison with the distance on the route
-
Max, min and average wind speed on the route
-
Average true wind angle
-
Polar used with its efficiencies
-
Wind and Current grib file used
-
Land avoidance parameter
-
Eventually, mixed routing parameters and time motoring.
-
-
-
- The bottom part of the roadbook lists all the waypoints and the course parameters:
- Start time of isochrone
- Position
- Distance to cover and travel time. This time is generally equal to the routing time step unless you have to make a tack or gybe during this isochrone
- Ground speed and ground heading (SOG/SOG), possibly to engine
- Real wind speed and direction (TWS/TWD), that of the grib file
- Surface wind angle (AWA), calculated from the actual wind from the grib file and modified by the current
- The bottom part of the roadbook lists all the waypoints and the course parameters:
A pivot point is an already calculated point on an isochrone from which we wants to resume routing.
Routing with a pivot point allows for very quick routing study as it soes not require to recalculate the entire routing and you do not have to edit the route.
Lest us take an example where we sail from Laredo, Spain to Concarneau, France. We set sails on Thursday, November 26 sailing a Sunfast 3200 in a high pressure system.

What would happen if we decided to keep sailing on port for four more hours at the beginning of the trip ?
Let us zoom towards the tack zone. Grey points appear on isochrones. They are the potential pivot points.

Let us long press a point 4 isochrones further such that we would sail upwind on port. The app offers to create a pivot point and to resume routing from that point.


We would sail for 4 more hours by delaying the tack…

The isochrones from the first routing are displayed again at the end of the run such that you can launch another routing with a pivot point.
You must choose a current source, atlas or grib files, depending on the type of navigation and your navigation area.
- Along the European coasts, when tidal currents are predominant (all coasts except the Baltic and the Mediterranean), choose the current atlases (see the help to load them)
- Elsewhere and especially "offshore", in the presence of oceanic currents, download a grib file of currents and use it.
- Load current atlases: refer to the specific help to load these atlases.
- In the Routing menu, check Currents then Current Atlas.
- Calculate the routing. The calculation takes into account the drift due to the current as well as the wind modification due to this drift.
Note that the calculations are much longer because the application must make many tidal calculations.
- You have 2 main sources of current grib files, refer to the help on grib files for more details.
- Copernicus - Mercator Ocean models that you download by choosing SailGrib as Source:
- Copernicus Global: covers the whole earth
- Copernicus Global Met: covers the entire earth at a wider mesh
- IBI : European Atlantic coasts, includes tidal currents
- ENWS: North Sea coasts, includes tidal currents
- Baltic
- Med
- The HYCOM model that you download by choosing GMN as Source.
The Hycom model covers the whole world.
- Copernicus - Mercator Ocean models that you download by choosing SailGrib as Source:
- In the Routing menu, check Currents then Current Grib
- Choose the current grib
- Run the routing
The app includes a virtual regatta mode where it tries to reproduce the calculation methods used in these regattas.
To switch to virtual regatta mode, go to the Settings menu. In the Virtual Regatta section :
- check the Virtual regatta mode. The app will automatically adjust some parameters to be as close as possible to the game.
- Update the polars. These polar are copied from our servers. If you do not find the polar for a race, send us an email with the Contact us menu. We will do our best to add it quickly.
Once in virtual regatta mode:
- Create your route as usual,
- Download a grib file. The only offered model is the gfs_vr_100 we try to reproduce the model used for the regatta.
The model is updated every 6 hours when data from the GFS model are ready:- 3:35 GMT, 9:35 GMT, 3:35 p.m. GMT and 9:35 p.m. GMT for the 24 hour forecasts
- 3:45 GMT, 9:45 GMT, 3:45 p.m. GMT and 9:45 p.m. GMT for the 48 hour forecasts
- 5:00 GMT, 11:00 GMT, 5:00 p.m. GMT and 11.00 p.m. GMT for forecasts up to 16 days.
If you do not download the grib file, the application will offer you to do it at the launch of the routing.
- Adjust your routing parameters
- Route: You need to edit the first waypoint of your route at each routing to adjust your starting position to your boat position in the game.
- Start date and time: this is the date and time start of the routing in local time
- Routing max days: If you want, for example, to simply make a 1 day routing with a 4 day grib file
- Grib time offset : do not check
- Race start : check if it is the start of the race. This is to avoid initial penalties.
- Polar: choose the one corresponding to the race. These are actually multi-sails polars. The app will automatically choose the fastest one at each point of calculation.
- Pro sails: If you have subscribed to this option
- Current sail : the boat current sail. For potential penalties calculations.
- Foils, Polish, Pro winches : if your boat has these options.
- Minimum wind speed : if it has been set for that race.
- Polar efficiency : by default, do not modify.
- Auto parameters: I suggest you start by using the app in Automatic mode ...
- Calculation method:
- Fast: to make a fast routing calculation that might not be very precise
- Standard: the most used.
- Precise: to use 10minutes time steps and a large number of calculated points for the next 12 hours. This is the mode to use if you have a powerful device and you want to take advantage of all the features of the app.
- Land avoidance: check it unless you are in the middle of the ocean and you want to speed up the calculation
- Shoreline: in general in auto mode.
- No go zones: Prohibits routing in these zones. The 60_south_east, 60_south_west, 55_south_east and 55_south_west zones are included in the app for around the world races.
- Grib time offset: probably not useful here.
- Penalties
- tack: check and leave the default values, 50% for 2 minutes
- sail change: check and leave the default values, 50% for 2 minutes
- Allow tacking inside isochrone: in general, leave this option checked
Everything is set, you can start routing.
Wind shift isochrones are displayed in red and you can run pivot routings on these isochrones.
The color of track segments corresponds to the sail used for that segment
Enjoy racing!
If you select this option, SailGrib will create a GPX file of the calculated routing. The file is saved by default in the sailgrib/gpx directory of your SD card or internal memory. You can choose the directory in which this file is saved.
This file can be downloaded to most GPS and OpenCPN. Be careful, SailGrib WR is only a planning tool for your navigation, some points of the route can be on land as the shoreline might not be precise enough.
If you select this option, SailGrib will create an Excel file of the calculated routing. The file is saved by default in the sailgrib/excel directory of your SD card or internal memory. You can change the directory in which this file is saved.
This file can be opened on Android devices with the free Google Sheets app or the free Microsoft Excel app.
The Excel file includes 2 sheets:
- A summary

- details of waypoints and different routing settings


SailGrib WR displays online charts that are automatically downloaded when you are on the Internet.
They are not nautical charts with the exception of US NOAA charts.
These "online" charts are stored in a "cache" of your device.
For your nautical charts, you can choose between 2 solutions: GeoGarage or Navionics.
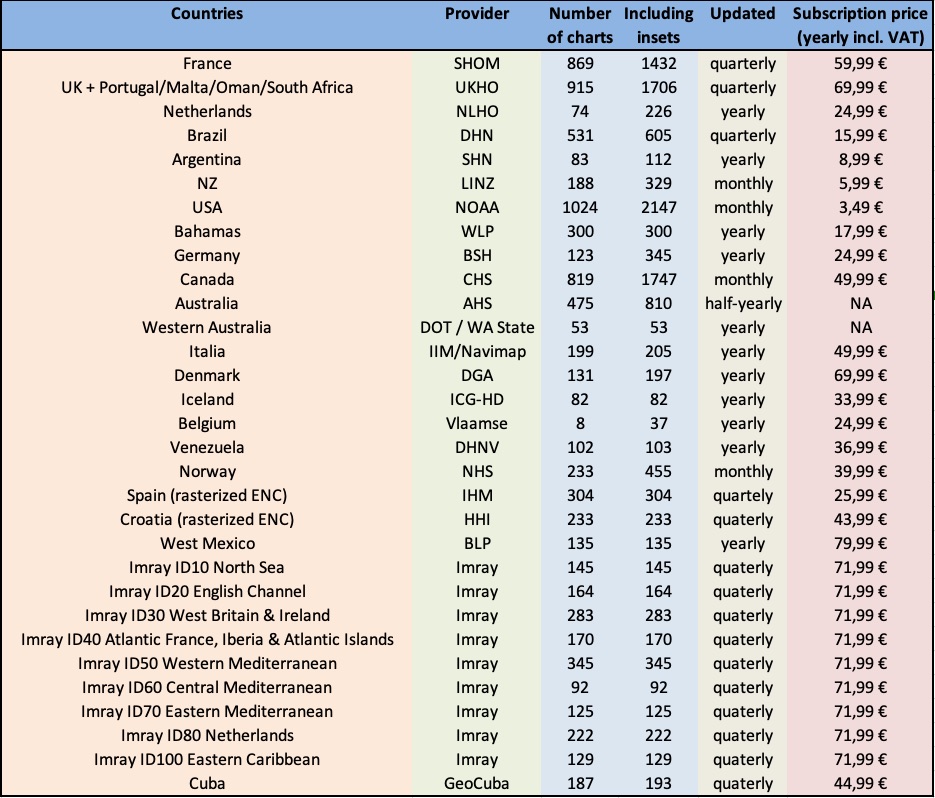
- Geogarage offers a very large catalog of raster nautical charts derived from digital charts provided by the International Hydrographic Services.
These charts, updated very frequently, are available as annual subscription to a hydrographic service such as SHOM, UKHO, NOAA...
They are automatically loaded when you move around on the chart. You can, and should, also load and store all the charts of your sailing area at once.
Note that the same subscription can be used in SailGrib WR on your Android devices (phone, tablets and Chromebooks) and in Weather4D on your iPhones and iPads. - Navionics : if you have a valid Navionics Boating license, you can download and display these charts in the app at no additional cost.
When your Android device is connected to the Internet, the application loads the tiles corresponding to the map visible on the screen. These tiles are stored in a database and can be reused later. They will be reused if they are new or when your device is no longer connected to the Internet. The app keeps up to 600 MB of tiles in the directory of your choice.
By default, except for the United States, the application starts loading "OpenStreetMap Mapnik" maps.
You have the choice between
- Default (OpenStreetMap Mapnik)
- Bing
- Bing satellite
- MapBox satellite
- NOAA marine
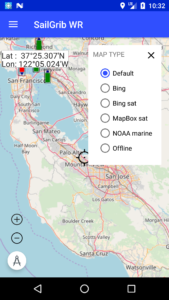
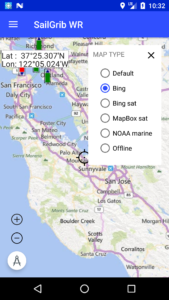
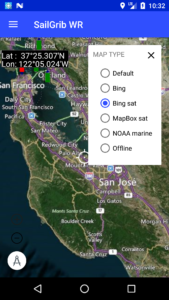
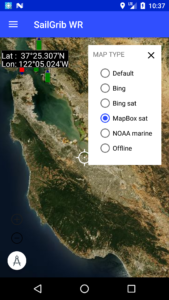
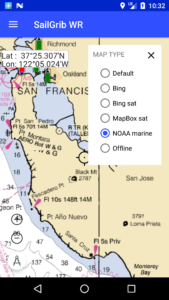
To switch from one type of card to another, press the layer button ![]() at the top right of the screen.
at the top right of the screen.
You will find the Geogarage catalog by following this link : https://www.geogarage.com/en_EN/page/catalog
The purchase of subscriptions is done on the Geogarage website. : https://accounts.geogarage.com/en/
L'utilisation des cartes est très simple:
- Sur le site de GéoGarage
- Créer un compte Géogarage
- Souscrire à un abonnement
- Dans SailGrib WR
Visionez un petit tuto ici : https://youtu.be/b4mSCydOfVw
- Aller dans Préférences > Cartes
- Entrer l'adresse mail et le mot de passe utilisés pour créer votre compte GeoGarage
- Choisir le service hydrographique dont on veut afficher les cartes
- Retourner sur l'écran principal de SailGrib WR et choisir la couche GeoGarage
Les cartes se chargent à la volée et sont stockées dans le cache cartographque de l'application. - Télécharger toutes les cartes de votre zone de navigation
- Aller dans Préférences > Cartes et cliquer sur "Télécharger des cartes"
- Choisi le niveau de détail souhaité. Le niveau cotier conviendra pour la plupart des zones de navigation cotière.
- Déplacer la carte et zoomer, la zone est définie par le carré de couleur
- Cliquer sur le bouton Télécharger
- Un atlas de cartes est créé sur les serveurs de GeoGarage puis téléchargé sur votre appareil
- Retourner sur l'écran principal de SailGrib WR
On the GeoGarage website : https://accounts.geogarage.com/en/
- Create a Geogarage account
- Subscribe to a subscription
- Go to Preferences > Maps
- Enter the email address and password used to create your GeoGarage account.
- Select the hydrographic service whose charts you want to display
- Return to the SailGrib WR main screen and choose the GeoGarage layer.
Maps load on the fly and are stored in the application's map cache.
- Go to Preferences > Charts and click on "Download Geogarage charts".
- Choose the desired level of detail.
- The Offshorelevel will be used to load large areas. Attention, detail maps will not be loaded.
- The coastal level will be suitable for most coastal navigation areas.
- The Harbor level loads detail maps. It is very rarely necessary to use it.
- Move the map and zoom, the area is defined by the square of color
- Click on the Download button
- A map atlas is created on the GeoGarage servers and then downloaded to your device in the sailgrib/geogarage directory in the main memory of your device.
This atlas is yours, you cannot share it with your friends.
You can, on the other hand, copy it to another of your devices.
No, the Geogarge maps for SailGrib WR are stored in the sailgrib/geogarage directory of your device.
- Go to Preferences > Charts and click on "Download GeoGarage charts".
- Already downloaded zones are displayed
- A message is displayed in the center of the zone if an update is available.
- Click on the dot in the center of the area and then click on the Update button.
- Go to Preferences > Charts and click on "Download GeoGarage charts".
- Already downloaded zones are displayed
- Click on the dot in the center of the area and then click on the Delete button.
No, you need either:
- the free version of SailGrib WR with the Premium option
- the paid version of SailGrib WR
and a valid GeoGarage subscription.
Request a password reset : https://accounts.geogarage.com/account/password/reset/
- Enter your email address.
- Click on the button "Reset my password"..
- If this email address is recognized, GeoGarage will send you an email that will allow you to re-initialize it.
- If it is not recognized, you took your subscription with another email address, enter the one you used to take your subscription.
If you encounter difficulties to reset your password, contact Geogarage at the following address: contact@geogarage.com.
If you have a Navionics app license on your Android device and a valid subscription, you can view these charts in SailGrib WR at no additional cost!
Navionics charts cover the entire globe. For more details follow this link to their website.
To view Navionics charts :
- make sure you are connected to the Internet
- go to Preferences / Chats then go down to Navionics section
- log into your Navionics account
- make sure you have a valid license for your device
return to the map, press the button at the top right and select Navionics. The detail maps will automatically load at high zoom.

To load a large area :
- go to Preferences / Charts then go down to Navionics section
- Press the "Download Charts" button and return to the map
- Pan and zoom the map. The area in the square will be downloaded. The square is fixed.
- Press the "Download" button. The charts will be downloaded in the background. Be patient.
- A downloaded area will appear with a light background on the base map.


You can display the OpenSeaMap "layer" over all maps. OpenSeaMap is an open source project to create free nautical charts.
Warning, not all buoys and beacons are entered in OpenSeaMap, some may be incorrect. We urge you to use this layer with caution.
We invite you to contribute to the project by adding or updating lighthouses and beacons in your navigation area. You will then need to use JOSM (Java OpenStreetMap Editor).
A small installation tutorial is available on YouTube here.
Here is an overview of La Rochelle Bay with and without the OpenSeaMap layer.
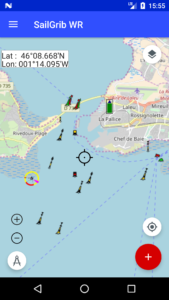
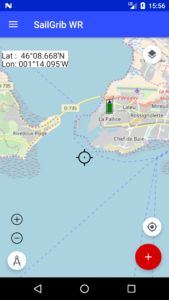
And the same using SHOM marine charts and with or without the OpenSeaMap layer.
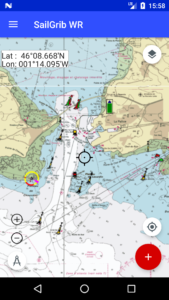
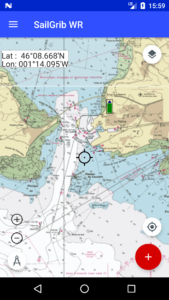
Atlases created from raster charts of hydrographic services can be purchased or downloaded directly into the app and stored in your device. These atlases are created from map images. The maps are clipped, cleaned and assembled to give a continuous atlas with different zoom levels.
Please note that no official hydrographic service has verified the information contained in the atlases and cannot be held responsible for the accuracy of their representation or for any subsequent modification. Possession of these atlases does not exempt from the obligation to use the appropriate nautical documents provided for by national or international regulations.
More specifically, for atlases derived from UKHO data, please note that :
"The UK Hydrographic Office (UKHO) and its licensors make no warranties or representations, express or implied, with respect to this product. The UKHO and its licensors have not verified the information within this product or quality assured it."
Similarly, SailGrib disclaims any liability related to the use of these atlases. Again, possession of these atlases does not exempt from the obligation to use the appropriate nautical documents provided for by national or international regulations.
In SailGrib WR, you can purchase the following atlases of marine charts :
- SHOM for France. All French metropolitan coasts are available (Channel, Atlantic, Mediterranean).
- derived form UKHO for Great Britain, Ireland, Spain, Portugal, the Eastern Atlantic Islands.
- derived from SHOM, UKHO and NOAA for the Caribbean island.
If you are looking for specific charts, do not hesitate to contact us.
If you are on the Internet, the list of proposed atlases will be automatically updated when you open the application. You can consult the detailed list by downloading the specific manual atlas_raster_en.pdf.
Once purchased in the Play Store, the maps are downloaded into the "Download" directory of your device and possibly copied into the directory you have chosen in the application. It can happen that the copy fails. In this case, use a file manager like ES Explorer to copy the atlas in sgtiles format in the directory you have chosen.
The atlas licenses are attached to the Gmail account you used to purchase them. The charts can only be used in SailGrib WR and with this account.
You can, however, use the application and maps on multiple devices as long as they are attached to the Gmail account used to purchase the application and atlases.
We will make our best effort to update the atlases once a year. You can update them by downloading them again within 365 days of purchase. Beyond this period, if you want to update the atlas, you will have to buy it again.
I encourage you to keep a copy of the atlas file in a safe location.
Here is for example the isle of Houat at several scales.
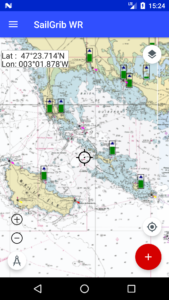
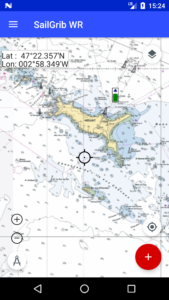
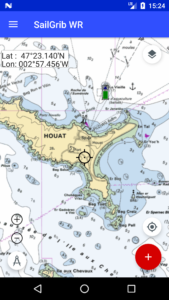
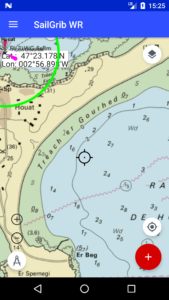
We offer free atlases from NOAA data for the United States. These atlases cover all the coasts of the United States and much of the Pacific.
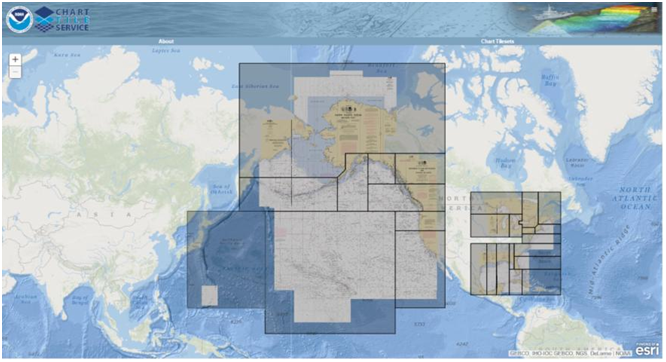
The free offline charts are stored in MBTiles format, the purchased ones are in a MBTiles derived format, one where we have encrypted the tiles. We have called it the SGTiles format.
You can also make your charts with tools like SASPlanet or MapTiler and copy them to your device.
The maximum zoom level is not constant for all chart areas. It varies according to the scale of the most accurate map for a given location. Thus, you will not have the same maximum zoom level for the port of La Rochelle as for the plateau of Rochebonne.
To compensate for this, if the application does not find a map at a sufficient scale for a given location, it will make an "Overzoom" of the most accurate map for that location. Overzoom" will appear discreetly on the tiles thus created on the fly.
You can create marks on your charts and use them in routes or by activating them in the navigation panel.
The navigation marks can be panning by toggling the switch in the menu.

To create a mark, long tap on the selected location on the map. The mark is added at this location, a screen opens up where you have to choose the type of mark in the list and enter:
- the name of the mark
- a comment
- the type of light for the mark
To edit the marks, toggle the Edit marks mode switch in the marks section of the menu.
Marks are saved in CSV files. The CSV files must be in the sailgrib/marks directory on your device. The fields separators are commas; the decimal separator is a point. The name of the mark should not contain spaces. Be careful not to put commas in your comments or the light characteristics.
We have created and saved in the app 3 demo files with the racing marks for:
- The Solent - UK
- La Rochelle - France
- La Trinité - France
Here are the first four lines of the larochelle_beacons.csv file which is loaded by default.

You can import or export marks in the Settings menu. The export option offers you to choose the marks one by one or as a function of the distance of the latter relative to your position.
When creating routes, the application will detect if you add a point near a mark and "paste" your new waypoint to this mark by copying the name and coordinates data.
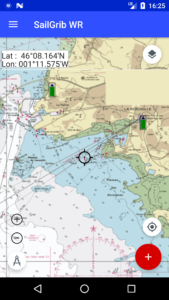
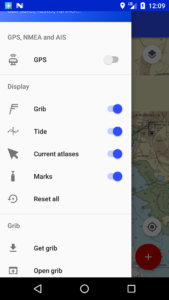
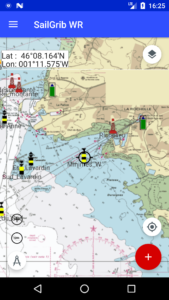
SailGrib WR can display your location and track in real time. The track is recorded in a service, allowing you to put the application in the background while continuing to record the track .
The navigation panel appears when you activate the GPS in the menu.

Once activated, you can hide or show the navigation panel by pressing the boat button:
 the panel is displayed
 the panel is hidden
The navigation panel gives the following information:
Le panneau de navigation donne les informations suivantes :
-
The time of the last GPS position fix
-
The accuracy of the position and the number of satellites used for the last fix if available
-
The coordinates of the last fix,
-
The Speed Over Ground and Course Over Ground
-
The name of the active route. If you have run a routing, the corresponding route is automatically activated.
-
The name of the active mark or waypoint. If you have run a routing, you can select any waypoint of the underlying route. By default, the second waypoint is activated; the first one being the starting position.
-
The Bearing To Waypoint
-
The Velocity Made good to Course which is the boat speed to the active mark.
-
The sailing Time To Go to the mark and Estimated Time of Arrival
-
A reset button to deactivate the active mark
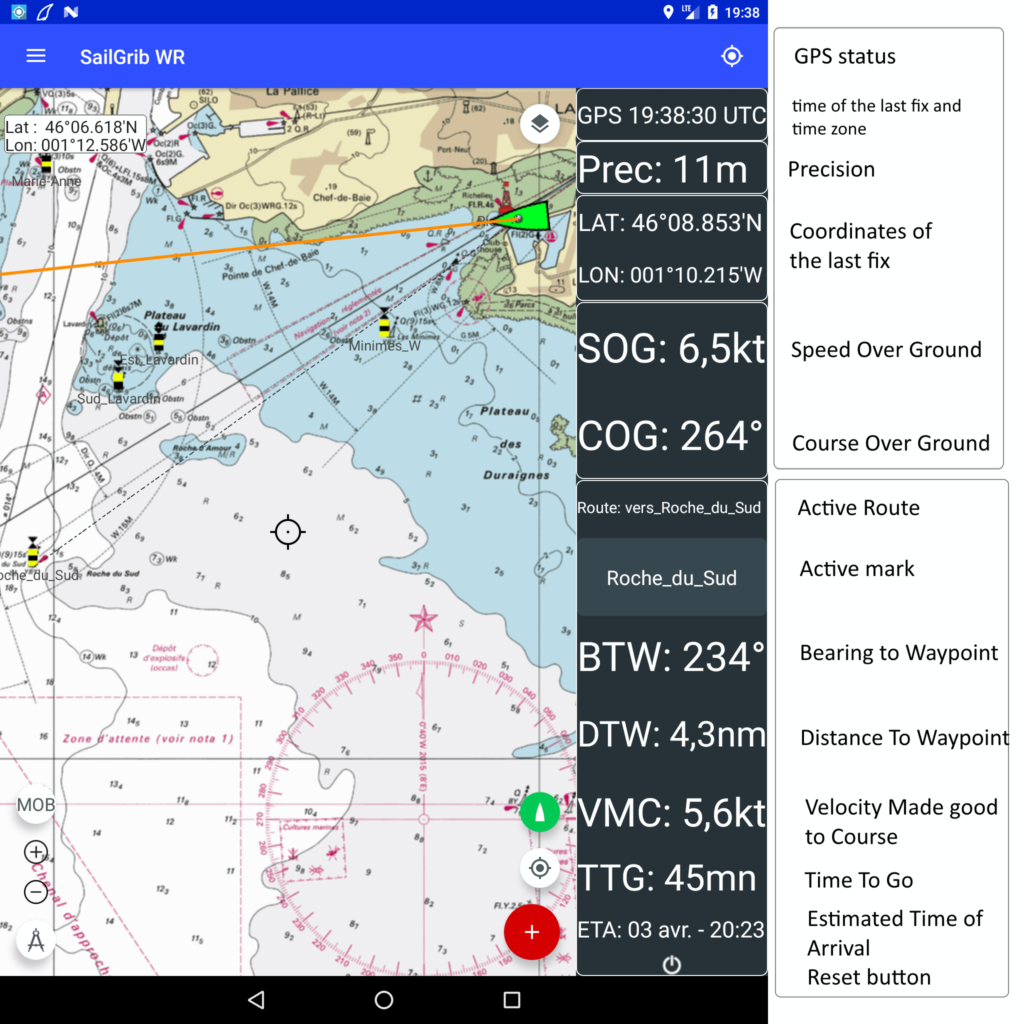
The app can connect in wifi to the NMEA 0183 feed of your navigation system and display the data on your Android device. SailGrib WR adds performance data calculated in real time to the NMEA feed.
For example, you can monitor your efficiency versus the polar that will be calculated based on the polar chosen for the last routing, your speed through water (STW) plus your true wind angle (TWA) and speed through water(STW).
If you have a NKE navigation system, SailGrib will publish back these performance data to the NKE bus. These data become accessible on Multigraphic displays
The connection to your marine instruments is done through WiFi.
Most modern multifunction instrument can publish its data in NMEA 0183 format over a WiFi network. If this is your setup, simply connect to that network.
Otherwise, you will have to connect your marine instruments to a wifi NMEA multiplexer. This is often a more flexible solution. You can wire multiple devices to the multiplexer that will publish in wifi a single NMEA feed. A fixed GPS, a navigation system, an AIS receiver or transponder can be connected at the same time.
We recommend the following multiplexers:
- the Digital Yacht multiplexers like the Smart WLN10 or the new Smart WLN30. These multiplexers have a Web interface that is used to easily the initial configuration of the devices. They supports the UDP and TCP protocols and 7 devices can receive data at the same time.
- If you are looking for all in one device which acts as a AIS transponder and a multiplexer, then go for the Digital Yacht AIT3000 or the new AIT5000. The new AIT5000 is a Class B+ AIS Transponder with a 5W power output that utilises SOTDMA format transmissions for an increased safety at sea.
- the MiniPlex-3Wi from ShipModul (or the old model MiniPlex-2Wi)
If you own a GMN Optimizer, you can connect your system to the USB input of the Optimizer. After configuration, the Optimizer will broadcast the NMEA data on its wireless network. You will, however be limited to a single NMEA source. To connect several sources to the Optimizer, you will have to go through a USB multiplexer such as MiniPlex Lite from ShipModul.
Once the wireless network ready, go to the wifi settings of your Android device to connect to it.
Then in SailGrib WR, from the Settings menu, go to NMEA Settings
- Enable the NMEA and AIS Connection
- Select your NMEA Source. We have pre-set the following sources:
- AIS-Share: an AIS Android app, we will come back to it in the AIS chapter.
- Digital Yacht
- DK Innovation
- GMN Optimizer
- NKE : to connect to a NKE wifi box
- Miniplex de ShipModul
- teamSurv
- vYacht
- Vesper Marine
- dAISy
- Log - for reading NMEA log files. We will come back to this later.
- Other, for manually setting the IP address of the multiplexer and the port on which the data are released.
-
Select the data transmission protocol, TCP or UDP. The UDP protocol is more flexible, there is no connection between the multiplexer and the app. The multiplexer simply broadcasts the data to a port. The application listens on this port. You can have as many devices as you want to listen to the multiplexer. A bad reception does not delay the data.
In TCP mode, each multiplexer will limit the number of connections (only 1 for Miniplex 3). A poor connection will delay the data. In addition, if a connection is not properly closed, the multiplexer must be restarted. -
Choose if you want to use the GPS from the NMEA feed. You will be able to switch off the internal GPS your Android device which will significantly reduce power consumption.
-
Choose whether you want to overwrite the speed and heading data of your instruments (CTW and STW) with those of your GPS (COG and SOG). This option is most often used if the speed sensor is dirty, or broken.
-
Choose if you want to save daily Log files of your NMEA data. These files are saved in the sailgrib/nmea directory. Depending on the NMEA output, they can be quite heavy, remember to delete them from time to time.
-
You can Start the NMEA service from this screen to verify that you are receiving data. Statistics on the data feed and the last sentence received are displayed.
Maintain your Internet connection
If your Android device is connected to the Internet by 4G, you will probably want to keep the 4G Internet connection while receiving data on board via WiFi from the multiplexer. It is possible. This requires that the multiplexer has not defined a default route (default Gateway) in 0.0.0.0.0. This is the case for recent multiplexers (Digital Yacht, Miniplex 3 with the latest firmware). If this is not the case for your multiplexer, you will need to establish a connection sharing from your mobile device and connect the multiplexer in client mode to your mobile's WiFi. Refer to your multiplexer's manual for instructions.
If you have connection problems, please refer to the dedicated FAQ.
Data are displayed either on a NMEA panel to the right of the screen or on the navigation panel. The panel can display 5 NMEA parameters in addition to the time of the last received NMEA message. The navigation panel button ![]() also controls the display of the NMEA panel. To start the service, press the button.
also controls the display of the NMEA panel. To start the service, press the button.
To start the service
- activate the GPS in the menu

When the service is active, the ![]() icon is displayed in white in the notification bar of your Android device at the top left of the screen. You can put the SailGrib WR application in the background while keeping the service active.
icon is displayed in white in the notification bar of your Android device at the top left of the screen. You can put the SailGrib WR application in the background while keeping the service active.
Warning: if you kill the application from the list of active applications, the NMEA service will be stopped. This is a change for version 3.0, in previous versions the data service was still running. Many users forgot it and saw the battery of their device run out...
You can choose the data for each of the 5 views from a list of parameters.
Note that for the performance data, the polar chosen in the routing menu is used.
Find in the below table the list of the parameters you can display.
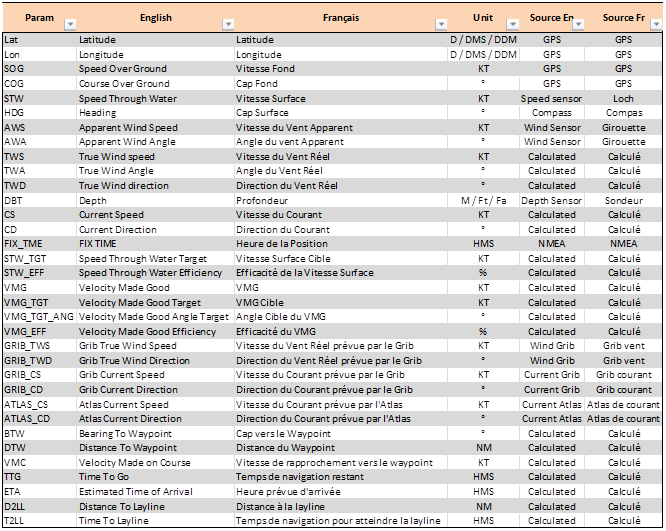
If your marine instruments provide wind data, SailGrib calculates the up and downwind laylines.
If your marine instruments calculate the true wind, it will be used, otherwise the app will use a simplified calculation of true wind.
Laylines include the effect of the current. You can choose different calculation modes:
- Ignore current
- Currents calculated based on the difference between SOG/COG and STW/CTW. This is the default mode. The calculation will take into account not only current but also the drift. You must have perfectly calibrated navigation instruments to get a correct result.
- Currents calculated from the atlases of current. This is the best choice if the instruments are not perfectly calibrated.
- Currents calculated from a grib of current. The reference is the latest grib used for routing.
If you have not activated a waypoint in the navigation panel, laylines will be drawn from the boat. The length of the layline matches the length of the COG predictor arrow in the AIS parameters.
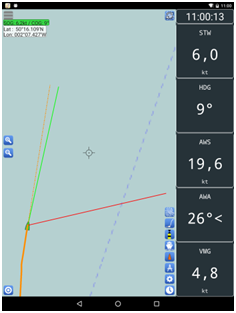
If a waypoint is activated in the navigation panel and if a tack or a jibe is required to reach the waypoint, the tacking or gybing point is calculated. Laylines are drawn and truncated at the optimum tack point. The distance to the layline and the time to reach the layline can be displayed in the NMEA panel.
We see in the below example that:
- The boat is sailing upwind at a slightly angle higher than the optimum one,
- The distance to the layline is 20.57 NM
- The sailing time to reach the layline is 3 hours 19 minutes
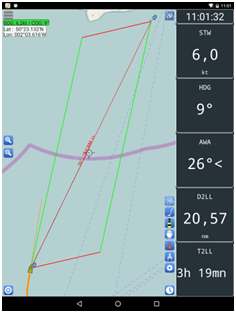
If the boat is over the layline, laylines are drawn from the boat and from the waypoint.
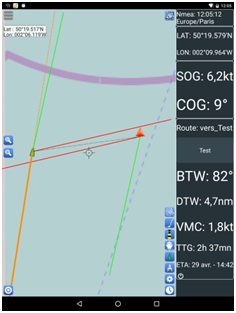
In the table below we present the list of NMEA 0183 sentences that the application can handle. We also indicate what priority is assigned to each.
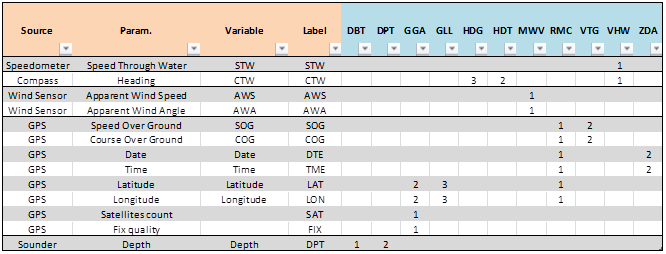
If you have a speedometer log on board, you have probably noticed that, very often, the speedometer log speed or surface speed (STW - Speed through water) is not correct: you must calibrate the speedometer log.
The calibration module helps you by providing you with a simple and quick calibration method based on the comparison of ground speed (SOG - Speed Over Ground) and surface speed.
Do not hesitate to do the calibration at each navigation. With a little practice, the procedure with 2 passes takes about 3 minutes.
The speedometer logs have a coefficient that is used to adjust the ground speed by multiplication. Before the first calibration, this coefficient is set at 1 for most manufacturers. We will calculate a new coefficient: new_coeff = SOG / STW * old_coeff
The procedure consists in calculating this coefficient by starting from the previously entered coefficient.
How to do it:
- choose a quiet place, without waves. The exit of your harbor is often the best place to go.
- start the engine at motor at about 5 knots. Do not touch the engine speed again during the procedure.
- make one or more passes depending on the current. In case of uncertainty, we recommend that you make 2 runs.
- In uncertainty or if we have a stable current, we make 2 runs, one against the current and the other with the current
- motor at about 5 knots against or with the current.
- start the calibration module. Menu > Settings> GPS NMEA > NMEA settings > Speedometer calibration
- If necessary, enter the current calibration coefficient of the speedometer log if it is different from the one displayed by the app.
- choose 2 runs
- wait until the speed is stabilized. When the Start button turns green, press it to start the procedure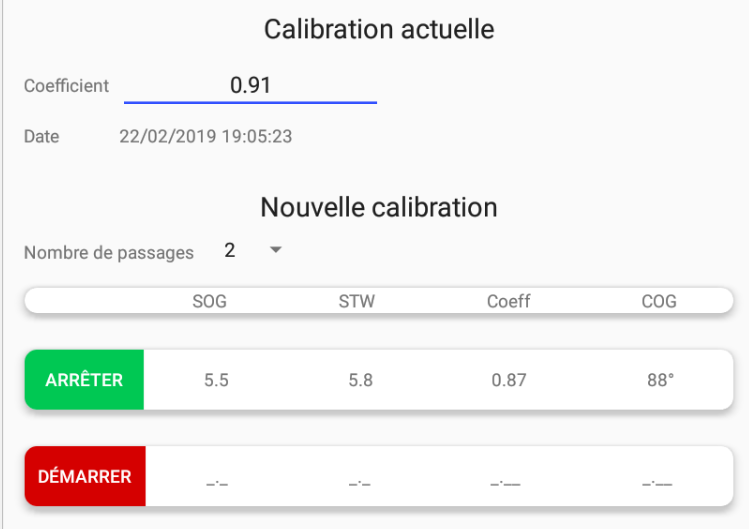
- progress over a few hundred meters or about a minute. At least wait until the Stop button turns green.
- press the Stop button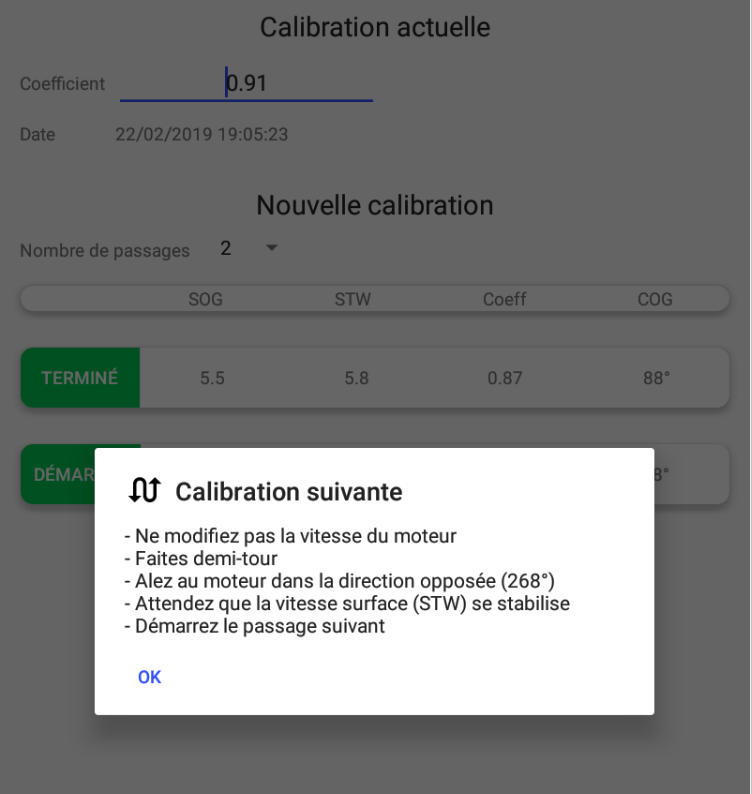
- turn around. The app tells you which course to follow on the other side (COG2 = COG1 + 180°). Do not touch the engine speed during the U turn.
- wait until the speed is stabilized. When the Start button turns green, press it to start the second run.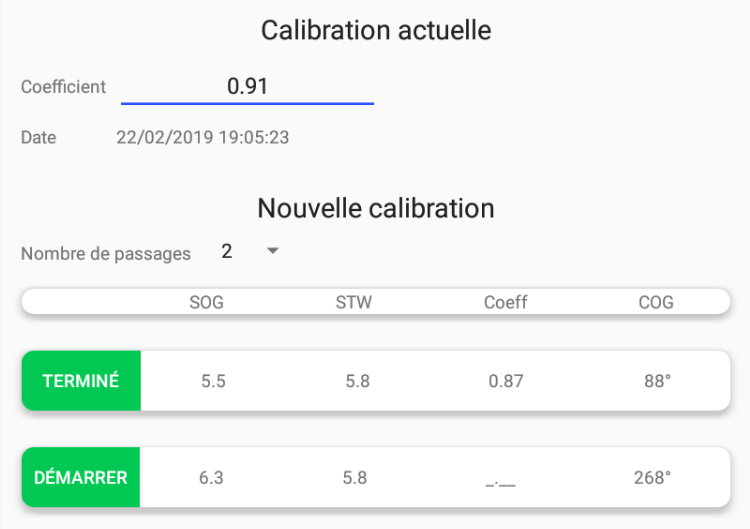
- progress over a few hundred meters or about a minute. At least wait until the Stop button turns green.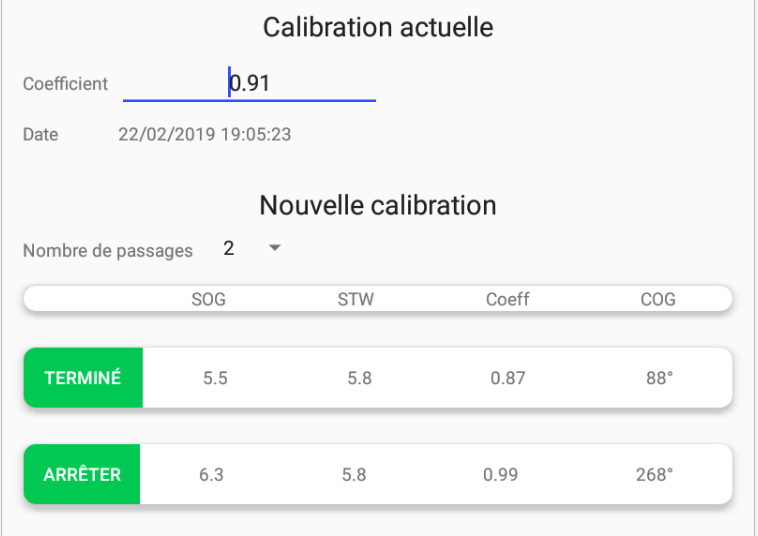
- press the Stop button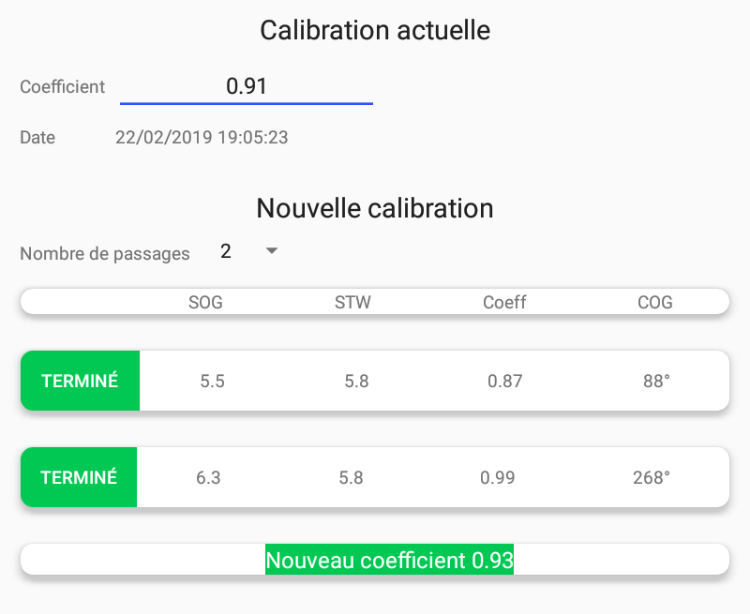
- the new coefficient is displayed. It has been calculated as follows: new_coeff = (SOG1 / STW1 + SOG2 / STW2) / 2 * old_coeff
- enter the new coefficient in the log. - if we don't have power, a simple run should suffice.
- motor at about 5 knots
- start the calibration module. Menu > Settings> GPS NMEA > NMEA settings > Speedometer calibration
- If necessary, enter the current calibration coefficient of the speedometer log if it is different from the one displayed by the app.
- choose 1 run
- wait until the speed is stabilized. When the Start button turns green, press it to start the procedure
- progress over a few hundred meters or about a minute. At least wait until the Stop button turns green.
- press the Stop button
- the new coefficient is displayed. It has been calculated as follows: new_coeff = SOG / STW * old_coeff
- enter the new coefficient in the speedometer log. - If we have a rapidly changing current over time, we make 3 runs. The second one will have a double weight to cancel the effect of the current.
- motor at about 5 knots against or with the current.
- start the calibration module. Menu > Settings> GPS NMEA > NMEA settings > Speedometer calibration
- If necessary, enter the current calibration coefficient of the speedometer log if it is different from the one displayed by the app.
- choose 3 runs
- wait until the speed is stabilized. When the Start button turns green, press it to start the procedure
- progress over a few hundred meters or about a minute. At least wait until the Stop button turns green.
- press the Stop button
- turn around. The application tells you which course to follow on the other side (COG2 = COG1 + 180°). Do not touch the engine speed during the U turn.
- wait until the speed is stabilized. When the Start button turns green, press it to start the second run..
- progress over a few hundred meters or about a minute. At least wait until the Stop button turns green.
- press the Stop button
- turn around. The app tells you which course to follow on the other side (COG3 = COG1). Do not touch the engine speed during the U turn.
- wait until the speed is stabilized. When the Start button turns green, press it to start the third run.
- progress over a few hundred meters or about a minute. At least wait until the Stop button turns green.
- press the Stop button
- the new coefficient is displayed. It has been calculated as follows:
new_coeff = (SOG1 / STW 1 + 2 * SOG2 / STW2 + SOG3 / STW3) / 4 * previous_coeff
- enter the new coefficient in the speedometer log.
- In uncertainty or if we have a stable current, we make 2 runs, one against the current and the other with the current
SailGrib can publish back to the NKE bus real time calculated data. These data can be displayed on NKE multifunction displays allowing the crew to have real-time performance data.
Once SailGrib WR is setup, make sure to configure your NKE wifi box and displays to receive these data.
On the wifi box wifi, you may need to make a new NMEA initialization by pressing the Init button for 6 seconds. Refer to the instructions in the wifi box manual.
On your display, it will most likely have to do a new NMEA initialisation, check the NKEuser manual. These procedures have to be done only once.
The Multigraphic can receive performance data in a dynamic format. To enable this data feed, go to "NMEA Settings" then "NKE Settings" and check the MuliGtraphic Dynamic Data option. Eight dynamic channels are configurable. For each of them choose to published data from the following list:
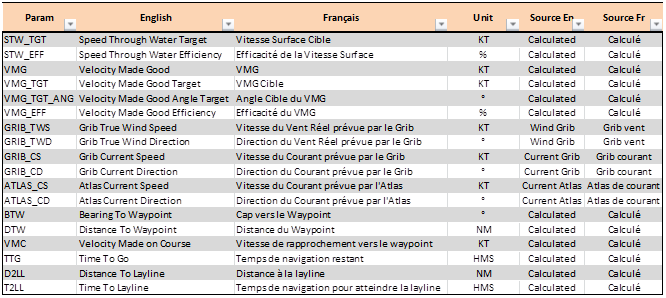
Here is a Multigraphic sample screenshot
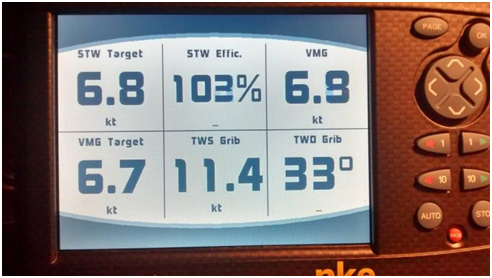
As we have seen it above, the app can save a log file in text format containing all NMEA 0183 sentences received. The app can then replay them. Log files are saved in the sailgrib/nmea directory.
When reading a log file, the application will behave as if it would receive data in real time. For example, AIS alarms will be raised.
SailGrib WR can read and play 2 formats of log files:
- SailGrib format: a text file where each line consists of a ISO8601 timestamp and a NMEA 0183 sentence.
2016-03-16T16:45:19.140Z $SDDBT,38.0,f,11.6,M,06.3,F*3E
2016-03-16T16:45:19.145Z $SDDPT,11.6,-1.0,99.0*7F
2016-03-16T16:45:19.150Z $HCHDG,331.3,00.0,E,00.0,E*40
2016-03-16T16:45:19.155Z $WIMWV,025.0,R,016.3,N,A*20
2016-03-16T16:45:19.177Z $VWVHW,129.0,T,129.0,M,07.7,N,14.3,K*52
2016-03-16T16:45:19.349Z GPRMC,164517.59,A,4601.47709,N,00114.10553,W,0008.9,303.6,160316,0.0,W,A*05
2016-03-16T16:45:19.491Z $GPGGA,164517.59,4601.47709,N,00114.10553,W,1,05,0.0,5,M,50.0,M,,*61
2016-03-16T16:45:19.594Z $GPGSA,A,3,02,03,14,23,31,,,,,,,,5.5,0.0,6.7*34
2016-03-16T16:45:20.129Z !AIVDM,1,1,,A,18vAfjo1hvwqN6PJHD8jHQrT050l,0*08
-
NKE format: the USB datalog Box includes a data logger that records the entire NMEA data stream and writes it on a micro SD card. You can replay the data in this file after copying it from the SD card to the sailgrib/nmea directory of your Android device.
The file will have a .nmea extension. The first line is a header, the second line indicates the starting tile of the log, the following lines are composed of a timestamp from the beginning of the recording and the NMEA sentence.
-- nke Display --
- 14-07-11 10:55:54
105.230197 $IIXDR,C,9.8,C,AirTemp*17
105.264203 $IIMTW,7.0,C*24
105.529122 $IIMWD,,T,167,M,16.1,N,8.3,M*49
105.540801 $IIMWV,56,T,16.1,N,A*20
105.560855 $IIVWT,56,R,16.1,N,8.3,M,29.8,K*6C
105.577142 $IIMWD,,T,160,M,16.1,N,8.3,M*4E
105.920317 $IIDPT,7.6,,*43
105.922810 $IIDBT,24.8,f,7.6,M,,*46
105.977768 $IIXDR,C,9.8,C,AirTemp*17
106.008639 $IIMTW,7.1,C*25
106.098530 $IIMWV,45,R,19.3,N,A*29
Two log files are integrated with the app as an example:
- SailGrib type: nmealog_20160316.txt
- NKE type: 14-07-11 105554.nmea
To play a log file:
- enable the Log reader mode in the NMEA Settings menu
- choose the Log file to be played
- return to the main screen. A banner was added at the bottom of the screen.

The left button allows you to start or pause playback.
The little slider lets you adjust the playback speed.
The great slider allows you to jump to a specific time and shows you where you are in the file.
The "reset" button on the right side allows you to return to the “live” mode.
SailGrib WR can receive AIS data (Automatic Identification System) through the boat NMEA feed or via Internet (if your device is connected to the Internet and the area is covered by AISHub). The app will read the received sentences, display AIS targets on the map and calculate for each of them the Closest Point of Approach (CPA) and warn in case of danger.
The target received and processed by SailGrib WR are the following:
- Class A: Mandatory since 2002 onboard most vessels over 300 tons and since 2014 for fishing vessels over 16 meters. They transmit at 12.5 W. If the propagation is good, you might see targets at over 30 nm.
- Class B installed on pleasure craft. They transmit at 2W for a visibility around 10 nm.
- Aid to Navigation (AtoN): primarily used to transmit the position of navigation marks such as the BXA buoy at the tip of the Gironde in France. The transponder can be physically installed on the device or on land. In such a case, it will have virtual tag.
- AIS SART (Search And Rescue Transmitter): introduced in 2010, the AIS SART individual emergency beacons transmit a signal in case of man overboard. They are now sometimes mandatory for offshore races. We strongly recommend them.
Every AIS target is identified by its MMSI number (Maritime Mobile Service Identity).
AIS Class A and B emit two types of messages:
- "static" data such as vessel name, vessel type, size, destination...
- positions data with among others the coordinates of the ship, its speed and heading.
Static messages are sent every 6 minutes. So you might have targets only identified for a while by their MMSI numbers. SailGrib retains the name attached to each MMSI. The enables the app to quickly identify by name known ships as soon as we receive a position message.
Position messages are transmitted:
- every 2 to 10 seconds depending on its speed for a class A vessel, and every 3 minutes if anchored,
- every 30 seconds for a class B ship whose speed is greater than 2 knots, every 3 minutes otherwise.
As soon as a position message is received, SailGrib calculates the CPA of the target. The CPA can be displayed on the map. If the CPA and the Time at CPA (TCPA) are less than a set limit an alarm can be thrown.
Watch a video of AIS targets in the Solent
In SailGrib WR, you can receive AIS data either from the receiver installed on your boat or via the Internet. The local flow will always have priority over the one from the Internet.
If your boat is equipped with an AIS receiver and the stream is available in WiFi, prefer this stream.
If you are connected to the Internet and the area is covered by the AISHub service you will be able to see and use this stream in real time. AISHub is a real-time AIS data sharing network to which SailGrib contributes and subscribes. Warning, not all areas are covered by AISHub.
You will find the AISHub coverage map here
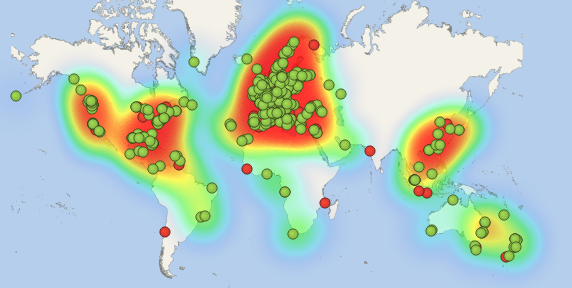
AISHub coverage on April 18, 2019
We strongly encourage you to contribute by sharing data from your AIS receiver while sailing. This will turn your boat into a mobile station.
Targets received by your boat's AIS receiver will be displayed in green, those received by Internet in blue.
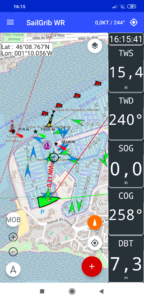
AIS messages are received through the NMEA stream. Refer to the previous chapter to set it. Once started, the NMEA service will process AIS messages regardless of the position of the AIS target display switch.
To display AIS targets:
- connect to the NMEA and AIS stream of your central unit
- start the GPS service from the menu
- activate the display of AIS targets in the menu
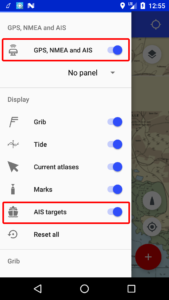
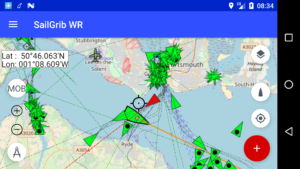
You can check data of a specific AIS target by pressing its icon.
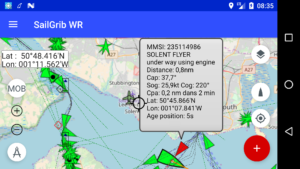
Watch a video of AIS targets in the Solent
- If not in "Navigation mode", if your device is connected to the Internet and you are sufficiently zoomed, check"AIS Targets", the app subscribes to the AIS data of the area covered by the map.
- While in "Navigation Mode", if your device is connected to the Internet and you are sufficiently zoomed, check "AIS Targets", the app subscribes to the AIS data of the area around your position. You can set the radius of AIS coverage in the AIS Settings.
Important: the area must be covered by AISHub for AIS targets to be displayed.
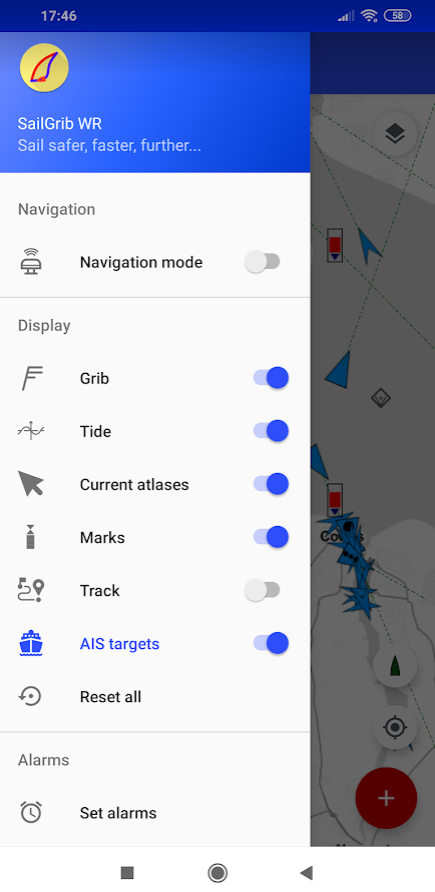
Not sailing
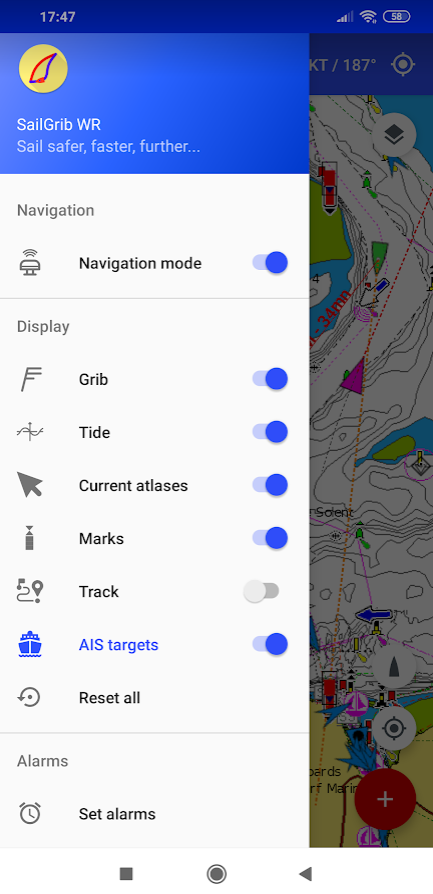
Sailing
Many parameters can be set in the "AIS Settings" menu to adjust the processing of AIS messages:
- General
- Own ship MMSI: enter your MMSI here to avoid CPA alarms with yourself! An MMSI is a 9-digit integer.
- Filter GPS data period: to reduce the number of messages to be processed in case your Android device would be overwhelmed. This can happen if your GPS id publishing messages with a high frequency.
- Display and process Class B AIS: for the start of races like the Transquadra, the Fastnet or Sidney Hobart, we uncheck this box to avoid false alarms and a cluttered screen.
- CPA - Closest Point of Approach
- No CPA calculation for targets at a distance over: these targets do not represent a danger in the near future, do not process them.
- Draw CPA segment: a segment will be drawn between the positions of our boat and the AIS target at the CPA. This segment allows you to check at a glance the relative positions of two ships at the CPA. For example we see here that the red target will cross in front of us.

-
Alarm if CPA is under: an alarm will be triggered if the CPA is under this value. We will adjust this value based on our boat speed, the density of the maritime traffic and our reaction time.
-
Alarm if the time to CPA is under: An alarm will be triggered if the time to the CPA is below this value. For example, it is probably unnecessary to raise an alarm if the CPA is 0.5 nm but the TCPA is one hour.
-
Play sound on alarm: An alarm sound will be played at the maximum level of the Android device even if the sound is turned off and or the application is closed as long as the NMEA Service is running.
-
Play sound on alarm for: the alarm will stop after this time. This prevents the alarm to keep playing if we are blocked at the helm.
-
Acknowledge alarm for: once you acknowledge an alarm, there will be no new alarm for this target during this period. If, at the end of the period, the target is still in alarm, a new alarm will sound.
-
Center on target if alarm: this allows you to see immediately which target is the source of the alarm.
- Display
- Show vessel names: display the name below the target. If the name has not been received yet and is not in the app database, the target MMSI will be displayed.

-
Show vessel speed : display the speed below the target. This is very convenient when racing to check your competitor’s speed.
-
Remove lost targets after: target icons fade out depending on the age of the last message received from the target and disappear at the end of the period set by this parameter.
-
Show COG predictor arrow for a length of: a line is drawn in front of each target based on its speed and its direction. This parameter defines the length of the segment in minutes. The length of the arrow in front of our boat is also set here.
-
Show tracks for the past: track of each target is plotted behind each target. This parameter defines the length of the track in minutes.
- Show vessel names: display the name below the target. If the name has not been received yet and is not in the app database, the target MMSI will be displayed.
- Historical AIS positions
- Number of days of AIS positions to keep in the app: to keep the app data size reasonable.
Generally speaking, targets received locally are displayed in green, those received by the Internet in blue.
1 - The following symbols are used in the application to display the AIS targets received with your AIS receiver.
- Class A AIS: fishing boat, cargo ship, ferry, ...
 default
 CPA alarm
 at anchor
 fishing
 restricted ability to maneuver
- Class B AIS: pleasure boat
 default
-
 CPA alarm
-
Aid to navigation
-
 default
 -
 off position
 -
 virtual
 -
 virtual, off position
-
- SART
-
 AIS SART beacon alarm
 -
 AIS SART beacon in test
 -
 SART plane or helicopter
-
- Base
-
 ground base
-
2 - The following symbols are used in the application to display AIS targets received via the Internet
- Class A AIS: fishing boat, cargo ship, ferry, ...
-
 default
 -
 CPA alarm
 -
 at anchor
 -
 fishing
 -
 restricted ability to maneuver
-
- Class B AIS: pleasure boat
-
 default
 -
 with meteorological or hydrological data
 -
 CPA alarm
-
-
Aid to navigation
-
 default
 -
 off position
 -
 virtual
 -
 virtual, off position
-
- SART
-
 AIS SART beacon alarm
 -
 AIS SART beacon in test
 -
 SART plane or helicopter
-
- Base
-
 ground base
 -
 ground base with meteorological or hydrological data
-
The NMEA Service continuously monitors if an AIS target is in alarm mode.
If this is the case, three types of notifications are triggered based your AIS parameters:
- the target in alarm mode turns red, the map will eventually center on the target
- an alarm will sound if the Play sound on alarm option is checked, the CPA and TCPA of the target satisfy the conditions of distance and time to CPA, the alarm has not been acknowledged recently. The sound will be different depending on the class of the AIS in alarm.
- an alarm message appears on the screen. You must acknowledge receipt of the alarm by pressing the button under the message. The target remains red and the alarm stops. The message will show, amongst other parameters the CPA, TCPA and if the target crosses in front or behind us.
Here is an example of an alarm situation. We are sailing in the bay of La Rochelle towards the Ile de Ré. We see a sailboat on the AIS, class B, at 2:00PM and a tanker, class A AIS, at 11:00AM. Two CPA alarms are raised, first for the sailboat and then for the tanker. Both cross in front of us at a reasonable distance. We do not modify our heading for the moment but we keep our eyes wide open.
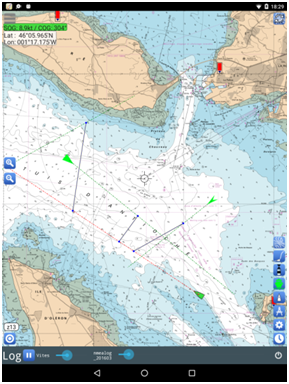
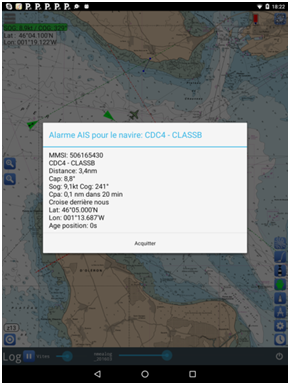
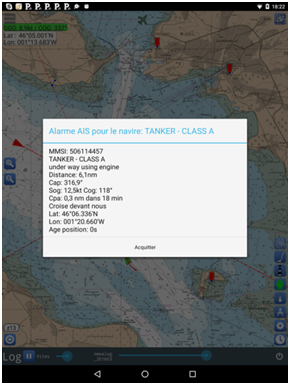
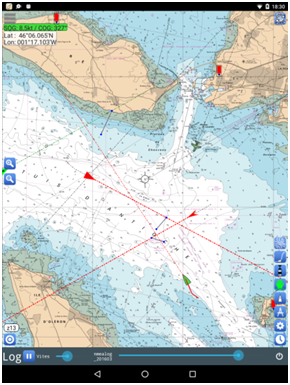
When AIS is enabled ,go to the menu and press the AIS Target List button
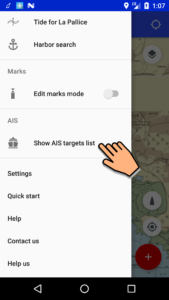
The list of AIS targets is displayed. Targets will be ranked in descending order of distance. The list will refresh when you view it.
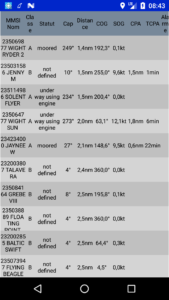
You do not have AIS receiver on board? Did you know that it is now possible to receive AIS data with a small and low cost AIS receiver called dAISy?
dAISy is an awesome, low cost AIS receiver that plugs directly into the USB port of your device with a USB OTG cable. Daisy is available online for $ 59 cost. A newer device, dAISy 2+ is available for $89.
Sélectionnez dAISy comme source nmea et le tour est joué. Pensez à sélectionner votre GPS interne comme source de position.
Select dAISy as your NMEA source, that’s it!
Do not forget to set your GPS source as internal.
To use the app during your cruising at the same as SailGrib, it is necessary to use a USB OTG cable that can simultaneously charge your tablet and the USB dongle. You can find some on www.dx.com.
With, the dAISy 2+, you can also buy a small wifi card (DT-06 TTL to Wifi) that will allow you to receive AIS data in WiFi and to power the dAISy separately. You can buy this card on the SmartArduino website for about 5$. You will find here the instructions for configuring the card. In SailGrib, select "Others" as the NMEA source and adjust your settings.
Finally, may I remind you that the theoretical reception distance can be roughly calculated using the formula: Distance = 2.2 x (+ √H1 √H2) where H1 and H2 are the heights of the two antennas in meters and the theoretical reception distance D in nautical miles.

So, if your antenna and the target are each at a 10 meter height, the theoretical reception distance is around 14 nm. If your antenna is only at a 1m high, the distance will decrease to 9 nm.
Caution: your receiver will not have the quality of a Marine AIS receiver; we assume no liability for the use of this type of device.
When sailing, it is often useful to be informed when the sailing conditions change.
The alarm module can be used in the following cases:
- I take a nap, if my speed drops below a certain limit, I want to be woken up

- if the wind turns, I'm under pilot, in wind mode, I want to be warned if my heading is moving away from my target heading. I then create 2 alarms:
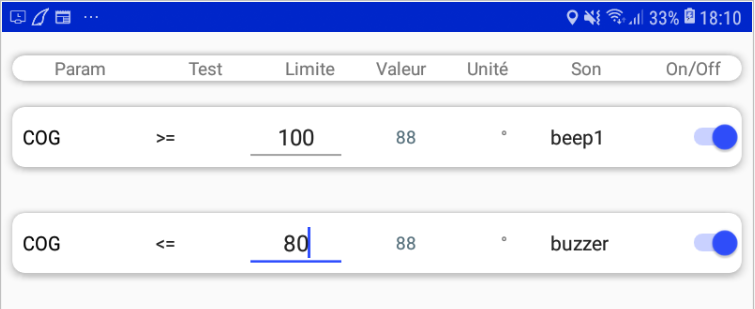
The Navygatio service offers the following services :
- Record all your sailing in SailGrib WR and Weather4D
- Save them on a server
- View them in near real time on www.navygatio.com
- Replay them at any time on www.navygatio.com
- Share your navigations with your friends registered on Navygatio
Today in Beta version, you will soon be able to :
- analyze your performance
- share your navigations publicly
- enter your log directly into SailGrib WR or Weather4D and on navygatio.com
- illustrate your navigations with photos
Here is for example the track of the SunFast 3200 "SailGrib" during the Gascony 45/5 race in May 2019.
The data was recorded every second.
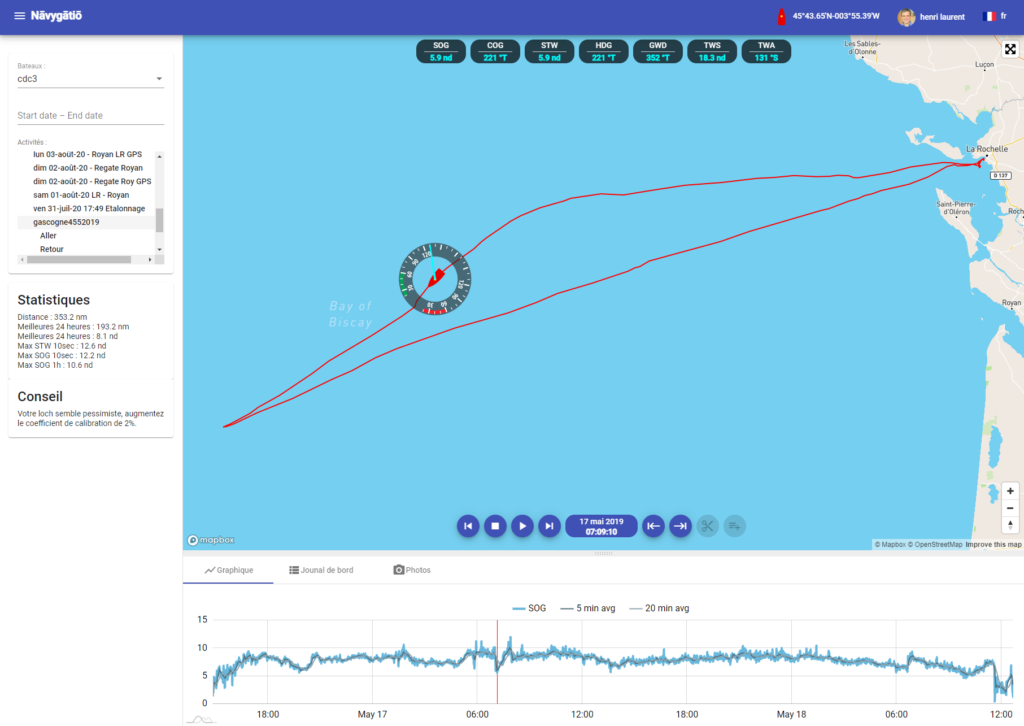
In SailGrib WR
- Press the + button at the bottom right and then the Preferences button
- Select Navygatio
- Press the Connect button
- Select your Google Account
- Your account is created on Navygatio with a boat "My boat" and an activity "My activity
You can then modify these names, add other boats or activities on the navygatio.com website.
For example, I named my boat "cdc3" and an activity "Regatta".
Once you have created an account, as soon as you start a navigation, its data will be recorded and transferred in near real time to the Navygatio servers.
- Data is recorded every second. The frequency can be adjusted in the Navygatio configuration screen.
- If your device has an Internet connection, data is transmitted to the Navygatio server every 10 minutes. The frequency can be adjusted in the Navygatio configuration screen between 1 minute and 6 hours.
If you're going offshore, it's best to change this transmission frequency to 6 hours and uncheck the transmission option. You can check it again when you reconnect to the Internet and the files will be uploaded to the Navygatio servers automatically. - Sf you lose your Internet connection, your data will be transmitted as soon as you regain a connection and SailGrib WR is open. For example, if you connect your phone to an internal on-board network to receive NMEA data, most of the time it will lose its connection to the Internet. As soon as you disconnect from that internal network and connect back to the Internet, your navigation data will be uploaded to the Navygatio servers.
Simply enter your boat's MMSI number in the boat configuration screen accessible by clicking on your profile picture at the top right of the navygatio.com home screen

Once your MMSI is registered in Navygatio, as soon as your ship's AIS is visible on the AISHub network, the transmitted AIS messages will be stored on the Navygatio servers.
Upon first receipt, an AIS tracking activity and a Track event will be created for your vessel.
You will then have access to your track.


1/ Enter the phone number of your Iridium Go in the Navygatio website
Enter your boat's Iridium Go phone number in the boat configuration screen accessible by clicking on your profile picture at the top right of the navygatio.com home screen
The number must be entered in international format without the + or 00.
For example :
881631015375 for standard Iridium numbers that start with 881
or
12126981315 for US flex numbers marketed by Pivotel

2/ Configure tracking in the Iridium Go
- On your Android (or iOS device), install the Iridium Go app from the Play Store (or App Store)

- Start the Iridium Go
- Connect to the Iridium Go WiFi network
- Launch the Iridium Go app and connect to the Iridium Go
- Go to the Settings > Track menu
- Choose a Tracking Frequency
We recommend 30 minutes for long crossings, you can go down to 5 minutes. - Enter the tracking email address in the Tracking recipient field
iridium@navygatio.com - Press the back button then Save
- Make sure that the GPS of the Iridium Go is activated by going to the menu Settings > Power
3/ Sail
When sailing, keep the Iridium Go on, an SMS will be automatically sent every n minutes depending on the tracking frequency you choose.
If you have an unlimited data subscription, which we recommend, your package includes unlimited SMS and you will not have any additional cost.
If your subscription does not have unlimited data, you will be charged for each SMS sent, ask your provider for the cost.
4/View your track on Navygatio
During your first sailing trip, after receiving 2 tracking messages from your Iridium Go, an Iridium tracking activity and a Track event will be created for your boat.
You will then have access to your track.

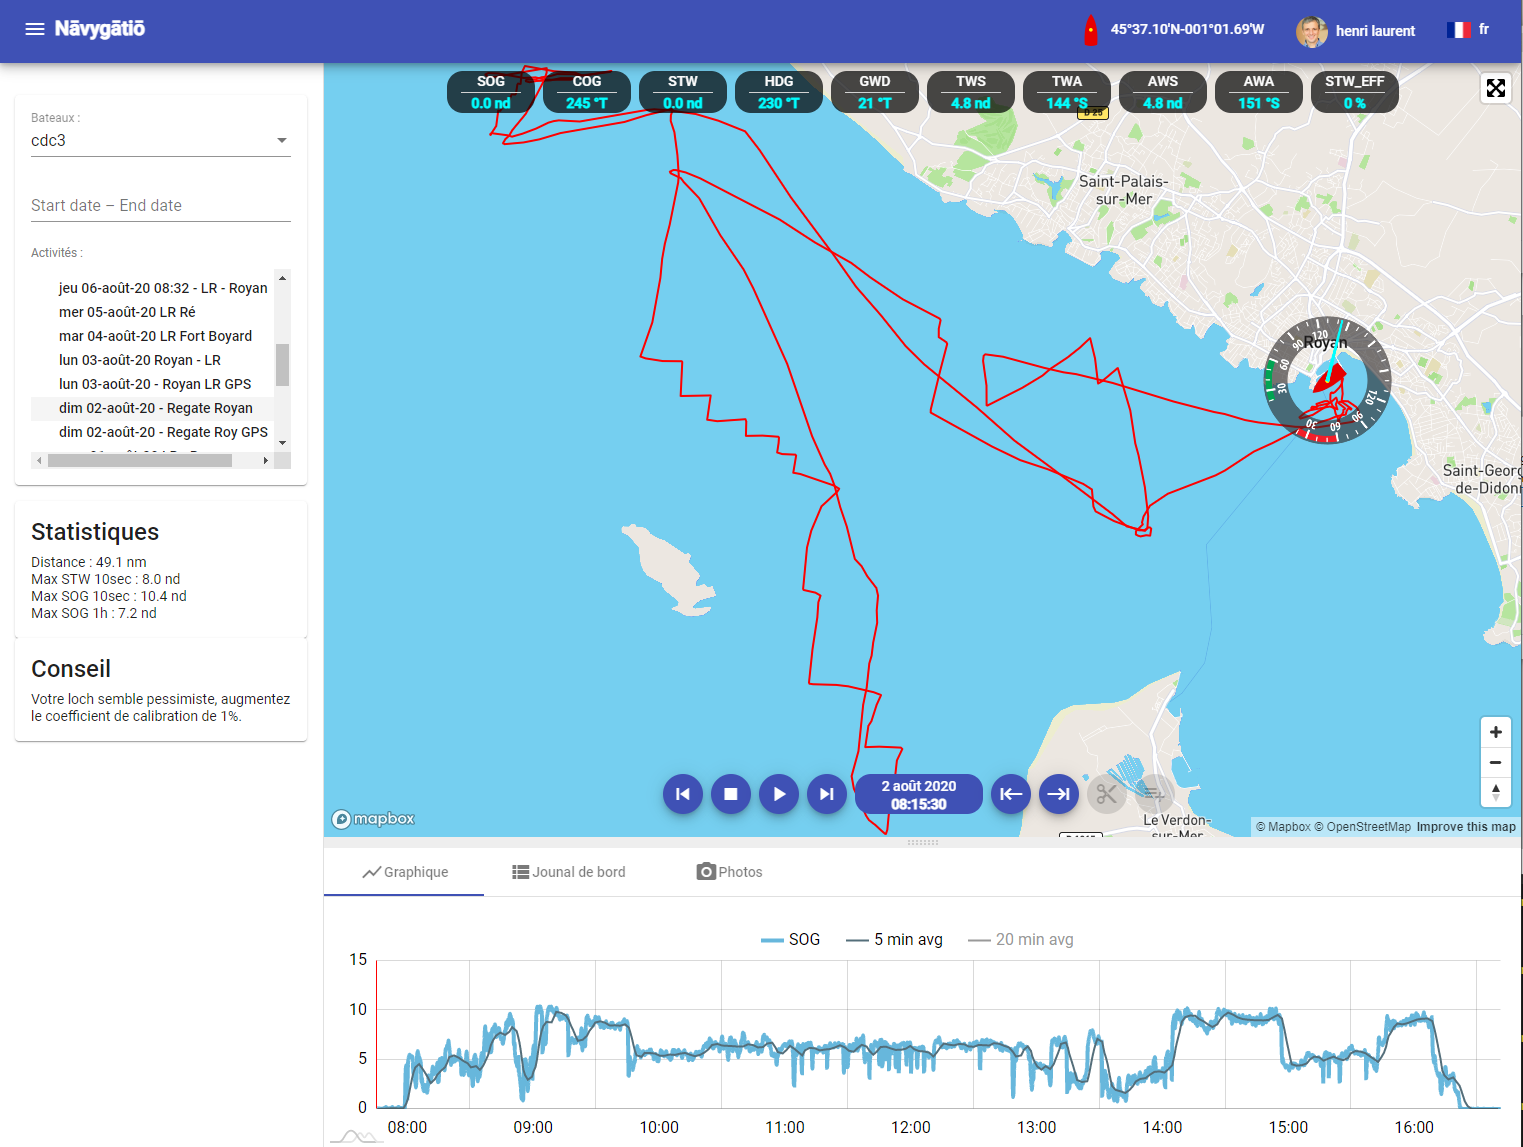
Or for a friend's boat
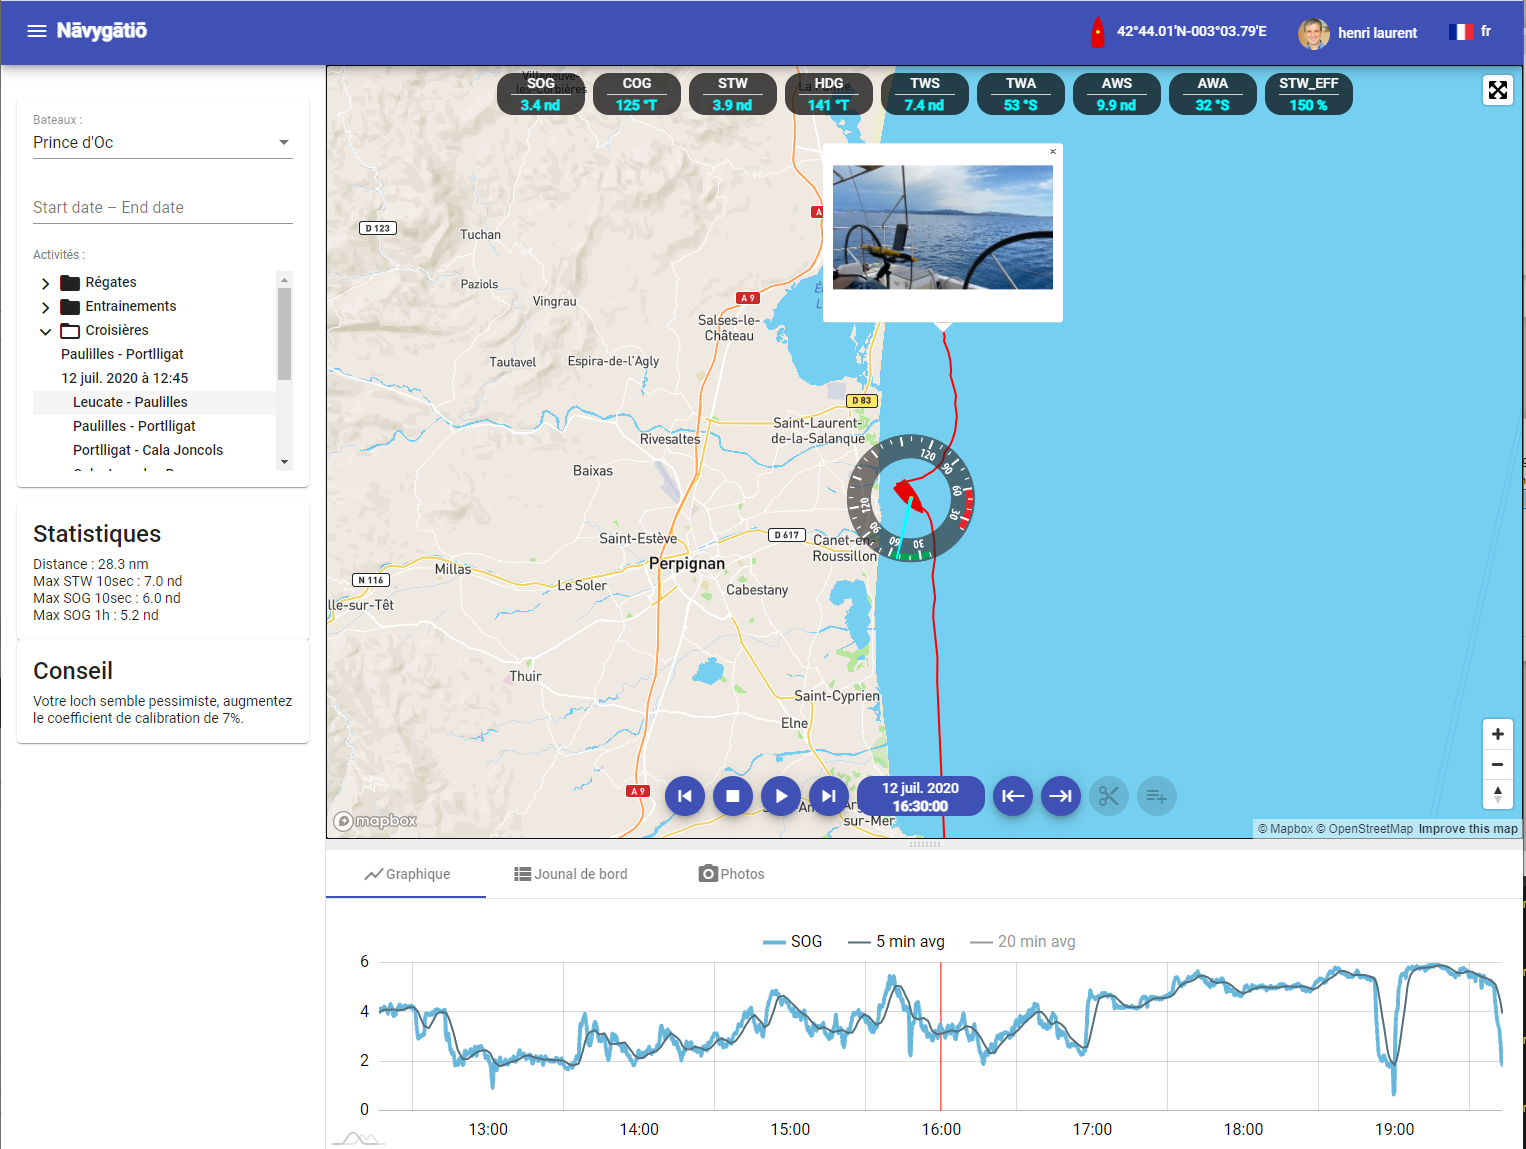
The management of your account is done on navygatio.com
Navygatio uses a mechanism that allows immediate synchronization of your information between the different media (website, SailGrib and Weather4D).
For example, if you add a boat on the website, you can immediately select it in SailGrib.
- My account
- Your boats
Add, edit, delete your boats
- Your followers
To view a friend's sailing trip, you and your friend must be registered with Navygatio.
Ask your friend to add you to his list of friends by telling him what e-mail address you used when you registered.
Activities
You navigations belong to one activity.
You can create as many activities as you want. For example: Cruising, Racing, Training...
To create an activity, press the + button under the last created activity.
Navigation
When you activate the Navigation mode in SailGrib WR, a new navigation is created in Navygatio in the activity selected in SailGrib's Navygatio Settings screen.
This new navigation is immediately added to navygatio.com.

When you point your mouse on a navigation, 3 dots appear on its right side which allow you to open a menu.
You can then:
- duplicate it
- change the activity
- add it to another navigation
- rename it
- delete it
Race boats might be tracked by satellite beacons during races (Argos, Yellowbrick Dolink,...). If that is the case, the race organization can send position files by email once or twice day to competitors or the competitors can subscribe to these position files.
This module allows the loading of a race file, the loading of these positions files, the viewing of the competitors on the map and calculates real time or rating adjusted rankings. The rating adjusted rankings calculation is made using the IRC method.
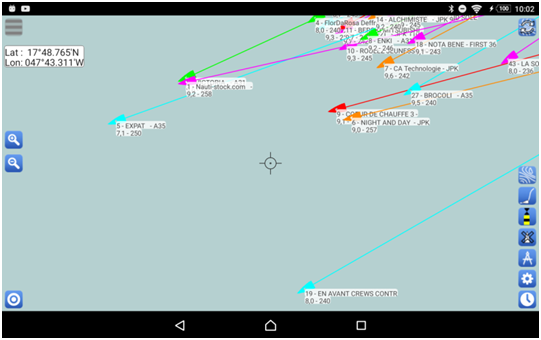
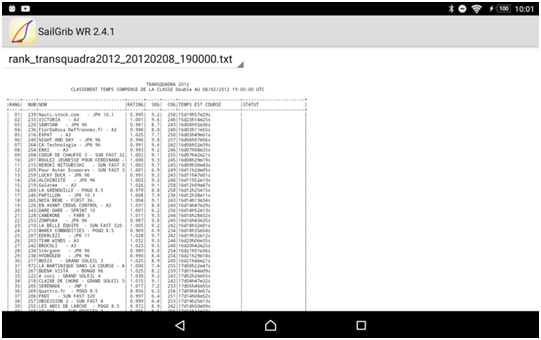
A race file includes, at the minimum, the list of the racing boats and their unique identifier for the race.
The race file might be provided by the race organizer, prepared by you or provided by the company in charge of the tracking.
Three file formats can be loaded into SailGrib:
- Adrena
- Expedition
- Maxsea
All of them are text files easily editable.
The file is a text file of extension .dcc whose fields are separated by semicolons. This is the most comprehensive format, you can specify the Class in which the boat competes and the boat IRC rating. This is the format that we will favor. The first line contains information about the race, the following ones describe the racing boats.
Let us take the example of the 2012 Transquadra. The first lines of the file are:
We will only change the race date and name on the first line. Do not modify the other fields
Then each boat is list on its own line:
In practice, we will only be interested in the yellow fields.
The file is a text file with a .txt extension. It is often called [race_name] _boatids.txt. The format of the file is very simple; it only contains the names of the boats and their id in the race separated by a comma.
1,40 Love
2,A’Assifa
3,Adelaide Star
4,Alkaid III - Nautistock.com
5,Alphalink/xtreme Yachting
6,Altikhan
7,Amazing Grace
8,Anahita
The file is a text file with a .txt extension. It is often called [race_name] _identifiant.txt. The format of the file is very simple; it only contains a first header line followed on each line by a line count, the names of the boats and their id in the race separated by one space.
identifiant nom
1 869 - MAHI-MAHI
2 624 - BLEEDING COWBOY
3 879 - LES POUPOULES
4 926 - LEOPARD
To make your job easier, you will find on the app website an Excel spreadsheet that makes it easy to prepare such a file.
Here's how the Excel sheet looks:
You will have to:
- Fill out the Blue cells
- Select a value in a drop-down for the green cells
- Click the “Export Race File” button. A file of name [racename].dcc file will be created in the temp directory of your c drive on your PC.
- Send a mail to yourself with this file attached.
- Open the mail on your Android device and save the attachment
If YellowBrick is in charge of the tracking, you will find on their site the race file in the Adrena, Expedition and Maxsea formats.
The Adrena file will however miss the IRC rating. You can add the rating either directly in SailGrib WR, or by editing the file with Excel using the worksheet provided on the app website.
To find these files on the Internet :
- Go on the YellowBrick race tracking page from the race website note the address. For example, for the mini Fastnet 2017, the address is http://yb.tl/minifastnet2017
- Copy the YellowBrick id for the race : minifastnet2017
- Paste this ID in the YellowBrick worksheet of the Excel spreadsheet.
- Click on the “Import Race file” button
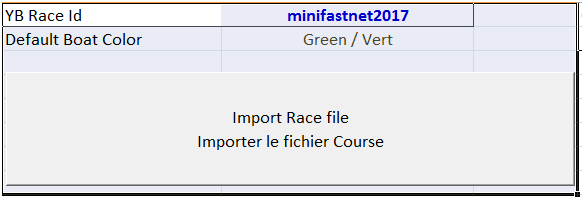
- Return to the Race worksheet, fill in the missing data and export the race minifastnet2017.dcc file by clicking the “Export Race File” button
- Send this file to yourself as an email attachment
- Open it on your Android device and save the attachment
- You have a race file, send it to your Gmail address, save it on your Android device.
-
Create a route for the racecourse. Here we create the route for the second leg of the Transquadra between Madeira and Ilet Cabri at the southern tip of Martinique. We call it TQS2. This route will be used to establish the rankings during the race.
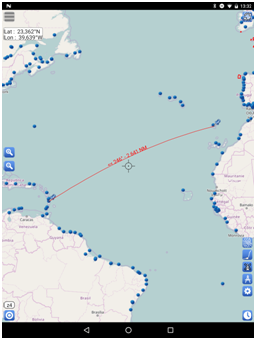
- Go in the Settings menue and press Race tracking
- Check Track a race
- Pres Load a race file
-
The list of the race files found in the Download and SailGrib/ is displayed.
Choose the file format to import between Adrena, expedition or Maxsea.
If Adrena is chosen, only .dcc files are listed, otherwise all the .txt are listed.
We will favor the Adrena format, which is more complete. -
Select the file to be imported by pressing it.
-
Press the Activate a race button.
The race boats are loaded and displayed. -
Press the Set race details button
-
Select the route created to define the route.
-
Select the waypoint that will be used to establish the rankings.
-
Select the day and time of departure. The time is to be entered in UTC time.
-
Choose the reference boat for performance analysis between rankings.
-
Press the Android Back button at the bottom left to exit this screen.
-
-
To select the boats you want to display on the map, you can:
-
Check the boats one by one
-
Filter the boats by entering a text in the "Filter" line, then clicking the "All" button. All filtered boats will be added to the list of checked boats.
-
At sea, the race organization may send files containing the positions of the boats in the race. Two formats are generally used, the Maxsea(or Adrena) format and the Expedition format.
Maxsea and Adrena use the same format. The only difference between Maxsea and Adrena is in the header line. The following lines include a line number, the boat Id in the race, the latitude, the longitude, and the UTC time of the position.

Note that the Maxsea/Adrena file header can also be: POSREPORT
Here again, we will prefer the Maxsea or Adrena format, easier to read with the naked eye.
To load a Positions file into SailGrib, first save the attachment. It will be saved in the Download directory of your Android device, then :
- press the Load a position file menu.
Note that :- the name of the active race is displayed under the Edit Race menu.
- The date of the most recent position is displayed under the Load Position File menu.
- Choose the file type to load and the date format of the positions
-
Then choose the position file to load. The most recent file is listed at the top.
When loading:-
the position file is moved from the Download directory to the sailgrib/race directory.
-
the number of positions found is displayed. Boats may be missing if the position has not been transmitted by the tracking beacon.
-
rankings are calculated. Wait until you see the Rankings calculated message before leaving the screen.
-
-
Make sure you have checked Display boats on map and eventually Display boat names on map.
-
Pick the Displayed ranking type between:
-
Gross overall
-
IRC overall
-
Gross by class
-
IRC by class
-
The selected boats are displayed with:
- their track
- their ranking
- the name of the boat
- the average speed since the last ranking
- the average heading since the last ranking

The rankings are calculated each time a position file is loaded.
- Press the Race Rankings menu.
All rankings are saved in text files in the sailgrib/race directory. File names begin with rank_.- Gross overall – always
- Overall IRC rating adjusted – if the IRC ratings have been entered
- Gross by class – if the race file includes multiple classesPick a ranking file in the drop-down.Files may include several rankings:
- IRC by class – if the IRC ratings have been entered and the race file includes multiple classes
At the end of the file you will find a table comparing the performance of a reference boat with the other boats for the last 4 rankings.
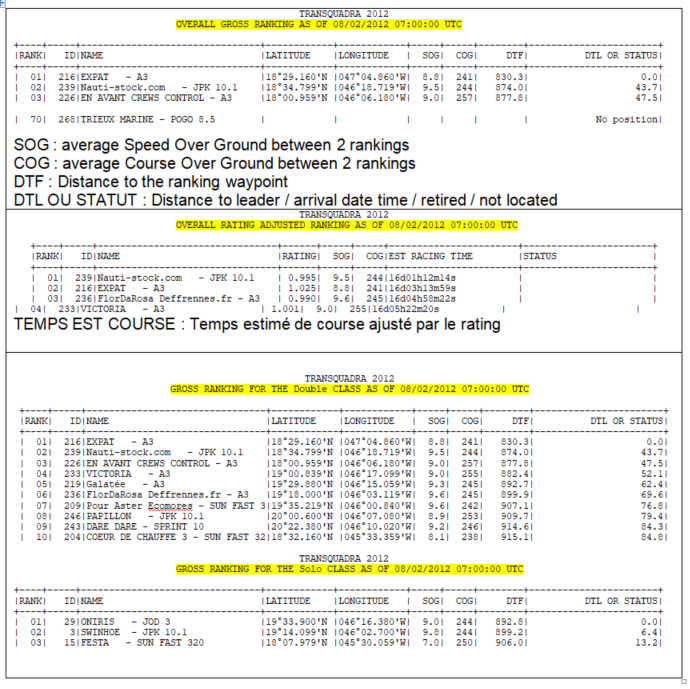
Race boat can be updated:
- To modify their parameters : name, color, rating
- To declare they are retired from the race
- To update their arrival date and time
To update a race boat:
- Press the Edit active race button
-
Select the boat either directly from the list or by typing in a filter.
For example, to search for the boat "Cornouailles Nautic", simply type "Cor" into the filter. -
Then press the Edit button
-
To report the boat retired from the race, check Retired and press the Save button.
-
To enter the arrival date and time:
-
Check Finished
-
Press the Finish date button and select the date
-
Press the Finish time UTC button and select the UTC time
-
Press the Save button
-
Any recent Android device (Android 8.0 or higher) of good quality with a GPS is suitable.
The app is compatible with Android 5.0 or higher. Android 5 was released at the end of 2014, it is better to buy more recent equipment.
We recommend using a tablet, it is much more comfortable.
Here are 3 tablets at the good value for money :
- SailProof SP08X or SP08S from 2023. The first rugged tablets dedicated to sailors and boaters: 8 inches, waterproof and really resistant, Galileo GPS and very readable in sunlight, big battery around 750€ (our first choice and installation on board). With the promo code GRIBPROOF, you get 5% discount on the whole SailProof website.
- Samsung Galaxy Tab Active 4 from 2022, 8 inches waterproof, Galileo GPS and sunlight readable, around 700€ (our second choice).
- Samsung Galaxy Tab A8 from 2021, 10,5 inches screen, around 240€. The simplest one with good quality, for use at the chart table.
- Check the upcoming ones here : http://tabletmonkeys.com/new-tablets/
or the just released ones here : http://tabletmonkeys.com/newest-tablets/
In our opinion, the best mid-range Android phone is the Google Pixel 6a from Q3 2022.
Chromebooks and Chromeboxes, computers running Chrome OS. SailGrib WR is extremely fast on these devices.
- The Acer Chromebox | Chromebox CXI3 Intel® Core™ i3-8130U 8GB - 64GB very fast, about $500. Our on-board installation.
- the Acer | Chromebook 714 for Work CB714-1W-P502 with its waterproof keyboard, around 520€.
- Be sure to register your new Android phone with Google using the same Gmail address.
- Open the Play Store app
- Search for SailGrib WR or follow this link
https://play.google.com/store/apps/details?id=com.sailgrib_wr.paid - Install the app
Yes, you can install the app on as many devices as you want as long as they are registered with Google using the same Gmail address.
Probably if your Chromebook is recent. You can install SailGrib WR on Chromebooks supporting the Play Store. You will find the list by following his link.
Warning: Chromebooks do not have, to date, GPS. It is relatively complicated to receive GPS data (bluetooth or WiFi) on a Chromebook.
- Subscribe to the Premium option for 1 month or 1 year.
Open the drawer menu and press the Upgrade button to do so.
Note that subscriptions are renewed automatically. - If you want to have a lifetime licence, you have 2 equivalent options:
- Purchase the paid version on the Play store:
Open the Google Play Store application by following this link :
https://play.google.com/store/apps/details?id=com.sailgrib_wr.paid - Buy the lifetime Premium option in the Free version.
Once you have purchased the lifetime Premium option, you are all set.
Do not try to install the paid version of the app.
If you do you will be prompted to pay again.
- Purchase the paid version on the Play store:
The procedure is the same as for any other subscription taken on the Google Play Store as described here.
Cancel a subscription
Uninstalling the app will not cancel your subscription.
- On your Android phone or tablet, open the Google Play Store
.
- Check if you’re signed in to the correct Google Account.
- Tap Menu
Subscriptions.
- Select the subscription you want to cancel.
- Tap Cancel subscription.
- Follow the instructions.
If the Play Store asks you to buy the application when you have already done so in the past with the same Gmail address, it's probably because the data in the Play Store app is corrupted. To repair that:
- Open your device's Settings app
.
- Tap Apps & notifications
See all apps.
- Scroll down and tap Google Play Store
.
- Tap Storage
Clear Cache.
- Next, tap Clear data.
- Re-open the Play Store & try your download again.
If this doesn't solve the problem, try following Google's advice by clicking on this link.
The number of days can be changed in the Grib query parameters.
If the number of days automatically returns to 2, you are still using the free version. Uninstall this free version and use the paid version. Everything should work fine.
First, confirm that:
- on your tablet, where you purchased the Premium option, the Premium features are working fine.
- your phone is registered with Google with the same Gmail address as the one used on your tablet.
If that is the case, it's probably because the data in the Google Play Store app are corrupted. To repair that:
- Open your device's Settings app
.
- Tap Apps & notifications
See all apps.
- Scroll down and tap Google Play Store
.
- Tap Storage
Clear Cache.
- Next, tap Clear data.
- Re-open the Play Store & try your download again.
If this doesn't solve the problem, try following Google's advice by clicking on this link.
Unfortunately, you are not alone in facing this problem.
The best solution I found is to ask a family member or friend in an authorized country to connect on a PC to Google Play with the gmail account you used to register your Android device and ask them to purchase the app. This one will then be automatically installed on your Android when your device will be connected to the Internet.
Here is the link to the app on the Play store: https://play.google.com/store/apps/details?id=com.sailgrib_wr.paid
And the list of authorized countries: https://support.google.com/googleplay/answer/143779?hl=en
You can possibly perform this procedure by taking control of the PC remotely using a service like TeamViewer.
Otherwise, you can buy the application from a PC via a proxy to make Google believe you are an authorized country.
Yes, you can upload it here.
It is a pdf printout of the online Help, FAQs and tips. We highly recommend to upload it if you sail offshore with no Internet connexion.
The free version is limited to :
- access to 2 days weather forecast only
- access to the GFS model only on SailGrib servers
- no current atlases for European coasts
- routings of less than 50 nautical miles
- 10 routings between 50 and 150 nautical miles
- no navigation panel
- no NMEA or AIS data
- no nautical charts
- no race tracking
Starting with V3.0, your device must run Android 5.0 or above.
If you have an Android 4.4 device, you can still run V2.4.6 but you will not be able to update it or reinstall it from the Play Store. I highly recommend that you make a backup of the app using an app like App Backup Restore.
No, it is not possible to buy the app outside the Google Play Store.
No. Today, SailGrib WR only runs on Android:
- phones and tablets (Samsung, Sony, Motorola, Huwei, LG,...)
- Chromebooks supporting the Play Store. You will find the list by following this link
No. Today, SailGrib WR only runs on Android:
- phones and tablets (Samsung, Sony, Motorola, Huwei, LG,...)
- Chromebooks supporting the Play Store. You will find the list by following this link
On a PC, you can install an Android emulator that will allow you to install SailGrib WR but you will have a degraded experience of the app. You will find a list of Android emulators by following this link.
Yes! We publish 3 other app for boaters and racers:
- SailGrib, our weather and tide app.
- SailGrib AA, our anchor alarm app. With this app the position of your boat will be constantly monitored. In the event of a confirmed alarm, an alarm will sound and you will receive an SMS. Leave a phone plugged into your boat and you have an anti-theft alarm!
- SailGrib RS, our regatta start app. With this app and its simplistic design, you'll know in real time where you are positioned in relation to the line and whether you're early or late for the start of the regatta.
Visit our Google Play Store page to install them!
Yes!
- Directly in the app, go to the menu and press Quick Start
- Watch the Quick Start Guide and other videos on our YouTube channel.
Before contacting us, please read the help and FAQs carefully. Most of the time, you will find the answer to your questions.
If you have not found the answer, send us an email using the Contact us menu of the app.
We usually answer questions very quickly. If not, we're probably at sea testing the latest developments!
Thank you for your patience.
The free version is limited to :
- access to 2 days weather forecast only
- access to the GFS model only on SailGrib servers
- no current atlases for European coasts
- routings of less than 50 nautical miles
- 10 routings between 50 and 150 nautical miles
- no navigation panel
- no NMEA or AIS data
- no nautical charts
- no race tracking
The number of days can be changed in the Grib query parameters.
If the number of days automatically returns to 2, you are still using the free version. Uninstall this free version and use the paid version. Everything should work fine.
| Grib update schedule by runtimes (UTC) | |||||||
| name | data | provider | type | 00Z | 06Z | 12Z | 18Z |
| GFS 0.25° | wind | NOAA | global | 5:40 | 11:40 | 17:40 | 23:50 |
| GFS 0.50° | wind | NOAA | global | 5:35 | 11:35 | 17:35 | 23:45 |
| GFS 1.00° | wind | NOAA | global | 5:50 | 11:50 | 17:50 | 0:00 |
| Arpège Monde 0.50° | wind | Meteo France | global | 4:00 | 15:35 | ||
| ICON GLOBAL 0.125° | wind | DWD | global | 4:00 | 16:00 | ||
| ICON GLOBAL 0.25° | wind | DWD | global | 4:00 | 16:00 | ||
| ICON GLOBAL 0.50° | wind | DWD | global | 4:00 | 16:00 | ||
| ICON GLOBAL 1.00° | wind | DWD | global | 4:00 | 16:00 | ||
| ICON Europe 0.07° | wind | DWD | regional | 4:15 | 10:15 | 16:15 | 22:15 |
| Arpège Europe 0.1° | wind | Meteo France | regional | 5:00 | 17:45 | ||
| Arôme 0.025° | wind | Meteo France | regional | 3:10 | 12:00 | 17:00 | 23:55 |
| Arôme HD 0.01° | wind | Meteo France | regional | 5:30 | 11:30 | 17:30 | 23:30 |
| Arôme Antilles 0.025° | wind | Meteo France | regional | 1:30 | 7:30 | 13:20 | 19:30 |
| NAM CONUS 0.1° | wind | NOAA | regional | 3:25 | 9:25 | 15:25 | 21:25 |
| NAM CONUS NEST 0.05° | wind | NOAA | regional | 3:15 | 9:15 | 15:15 | 21:15 |
| HRR CONUS 0.025° | wind | NOAA | regional | 0:40 | every H+40 | ||
| WW3 Global 0.5° | wave | NOAA | global | 5:15 | 11:15 | 17:15 | 23:15 |
| Copernicus Global 0.08° | current | Copernicus | global | 12:35 | |||
| Copernicus Global MET 0.25° | current | Copernicus | global | 12:45 | |||
| Copernicus IBI 0.03° | current | Copernicus | regional | 4:45 | |||
| Copernicus ENWS 0.06° | current | Copernicus | regional | 12:55 | |||
| Copernicus BALTIC 0.2° | current | Copernicus | regional | 10:45 | |||
| Copernicus MED 0.06° | current | Copernicus | regional | 3:45 | |||
| NCOM Alaska - N. Calif 0.03° | current | NCOM | regional | 16:05 | |||
| NCOM Caribbean 0.03° | current | NCOM | regional | 16:10 | |||
| NCOM Hawaii 0.03° | current | NCOM | regional | 16:15 | |||
| NCOM South California 0.03° | current | NCOM | regional | 14:05 | |||
| NCOM US East Coast 0.03° | current | NCOM | regional | 11:05 | |||
Only the GFS model has forecasts beyond 8 days.
To obtain more than 8 days of forecasts, you must either select in the Grib request menu:
- Source SailGrib and one of the GFS models
- Source SailDocs and the GFS model.
And ask for up to 16 days.
By default, the area that the app will retrieve and display corresponds to the map you have on the screen.
You can pan and zoom it.
You can also request an ad-hoc zone.
To do so:
- Long press the screen
- Press the Set grib zone menu
- Adjust the zone by moving the upper left and lower right corners
No, SailGrib cannot read zygrib files.
No, SailGrib cannot read files in grib1 format
Grib files weather data are derived from mathematical models. They're not always accurate!
In addition, it is necessary to match the chosen model with your type of navigation.
The GFS model covers the entire earth with a grid of 0.25° (about 15 NM). It will not be able to take into account local phenomena. And even offshore, the GFS could be wrong! They're just forecasts.
One of SailGrib's strengths is that you have access to several models!
For a coastal navigation, you can for example choose the high resolution models;
- in the US, the NAM models from the NOAA.
- in Europe the Arpège Europe model from Météo France.
- in France, you can get the Arôme model from Météo France, a very high resolution model.
You probably picked the wrong model.
Choose SailGrib as source and model
- Choose SailGrib as the source and the ww3_global model or SailDocs and the GFS model.
- In both cases, check the "waves" parameter.
- In the grib display menu, also check one of the "waves" options.
- install the iridium Go! app on your device.
install link: https://play.google.com/store/apps/details?id=com.iridiumgo
- install the iridium Mail and Web app as well.
https://play.google.com/store/apps/details?id=com.iridium.mailandweb - Register with iridium to get a specific iridium email address
registration link : https://www.iridium.com/mailandweb/
- in SailGrib WR, you will get the grib file through a mail exchange.
You have to use SailDocs (or Great Circle) as the source of your grib files.
The Source is set in the grib request parameters.
In practice, to request a grib:- set your Source to SailDocs
- set your model generally to GFS
- check at the bottom of the screen the box “Make your request with iridium”
- enter your iridium email address just below
- Request the grib. A mail is prepared and sent to the iridium Mail and Web app.
- Go to the iridium Mail and Web app and send the email through the iridium network
- wait for 5 minutes
- Get your mails in the iridium Mail and Web app, you should receive a mail from SailDocs in your mailbox. Show all the details of the mail: tap the Menu button and show all details. The attached file will be shown with a download button.
- Save the grib file which comes as an attachment.
- Open the file in SailGrib.
Be careful that the max size should be around 70kb for the grib file.
To get the entire Atlantic, set the grid resolution to 2.5° with a 6 hour timestep or 1° and a 12 hour timestep
And most importantly, train before you set sails. First with WiFi, to make sure you set the correct parameters to get a grib file size of 50kb or less. Second, with the Go! to get an actual file.
If you do not have an external antenna for the Go!, it will work better when the Go! is outside with a clear sky view.
Access to the included current atlases, that permit the integration of the tidal currents along the European coasts for weather routing, is restricted to the paid version of SailGrib WR.
Upgrade!
The access to the Copernicus Mercator Ocean currents grib files is restricted to the paid version of SailGrib WR.
Upgrade!
Yes, if you have the Paid version or the Premium option, SailGrib WR comes with the iPolar module developed by KND for iOS .
KND is a world leader in sailing performance analysis with over 15 years of experience in the field of speed prediction programs (VPP) for racing yachts.
We thank Dimitri Nicolopoulos-Salle, founder of KND, for giving us access to the iPolar code.
iPolar computes the performance polars of a given boat as a function of a reduced set of parameters:
- Length Overall (LOA)
- Waterline Length (LWL) if unknown, iPolar will make the assumption that LWL is 95% of LOA
- Displacement
- MainSail Area
- Jib Area
- Symmetrical spinnaker area (optional)
- Asymmetrical spinnaker area(optional)
Limitations of iPolar:
- Currently only handles monohulls
- LOA ranging from 8 to 20m
Accuracy:
iPolar is a very simple Velocity Prediction Program (VPP) which predicts the polars of a boat based on a very limited range of parameters: length, displacement and sail area .
This simplicity implies some restrictions : iPolar is meant to predict reasonably accurately polars for production cruisers and cruiser racers - it is currently limited to mono-hulls.
For boats significantly outside of the iPolar parameter range and for racing polars accuracy, the use of more complex VPP tools is required. KND-SailingPerformance uses the NorthSails VPP, developed through several cycles of America's Cup, relying for each boat on the generation of a large matrix of hydrodynamic forces (through Computational Fluid Dynamics or CFD methods) and advanced sails models. In case you would be interested in such a VPP for your yacht, contact us directly.
When you run a routing, do not start or end inside a bay. If you wish to make a routing ending in the bay of Ajaccio, add a waypoint at the entrance of the Bay South of the “Sanguinaires Islands . The routing should work.
broad question... with many potential answers.
Here are the most likely:
- The wind does not match forecasts.
- The boat speed does not correspond to the polar: optimistic polar, navigation in "cruise" mode, dirty hull, worn sails, sea state... you can edit the polar or simply play with the 2 efficiency parameters.'
- do not forget the maneuver’s time at the exit and at the entrance of the harbor or anchorage; I typically add 1 hour.
- presence of current: did you load a current grib?
You have 2 possibilities:
- move the waypoint directly on the screen.
- Make sure the route is loaded
- Long press the screen and select Manage route /Edit route mode
- Press any waypoint and hold it and move it.
- Edit the waypoint coordinates
- Make sure the route is loaded
- Long press the screen and select Manage route /Edit route mode
- Press the Edit button
- Press a waypoint
- Edit its coordinate
- Press Ok
- Press Open
You have 3 possibilities:
- Long press the small square summarizing the routing in the top right. A menu pops up, unload the routing.
- Go to the menu, press Load Routing. Select the one or ones you want to display.
- You can reset all the loaded data (grib, route and routings): long press the screen and choose the Reset all menu.
Yes since the Boating app was updated in July 2019.
- Export the route from the Boating app, a list of applications is displayed.
- Choose your file manager and save the route in the download directory of your Android device.
If you do not have a file manager, install the Mi File Manager app
- Rename the file if you want.
- In SailGrib WR, long tap on the screen > Manage Routes > Import a route in GPX format and choose the file to import.
No, Navionics does not allow route imports.
A SailChart in SailGrib WR is a table that indicates the optimal sail for a given wind speed (TWS) and wind angle (TWA).
The optimum sail is then displayed in:
- weather routings
- the measuring tool to determine, for example, the best sail on the next leg
- the quick measuring tool
The table representing the SailChart is saved in a text file with a .sail extension whose data is separated by tabs.
The first line starts with ![]() and continues with a list of true wind speeds (TWS)
and continues with a list of true wind speeds (TWS)
The following lines start with a true wind angle (TWA) and continue with the list of optimal sails for this TWA

It is relatively easy to modify a SailChart using a text editor.
We have made an Excel sheet that allows you to create your own SailChart.
You can download it here.
1/ Create a SailChart
The font color of the cells to be filled is navy blue
- Enter the list of your headsails or spinnakers in the blue range[N3:N18].
The sail in the cell 45°/10 knots represents the optimal sail from 45° of TWA and 10 knots of TWS.
- Choose the optimal sail for each cell in the range[B4:L21].
- Enter the name of the sailchart in cell[C1].
- Enter the directory where the sailchart will be saved in cell[C26].
- Click on the[Click to create the SailGrib SailChart] button

2/Activate the SailChart in SailGrib WR
- Send you by email the SailChart file you just created
- On your Android device, open the email and save the attachment
- SailGrib WR will automatically copy it on your device into the sailgrib directory, under the sailchart subdirectory
- Select the SailChart from the Routing menu

- In the routing menu, check SailChart and choose your SailChart
- Run the routing
- Press the blue button on the Running Table at the bottom right of the screen
- The best sail is displayed on each line of the roadbook.

This function uses the instantaneous wind measurement (TWD and TWA) from the NMEA flow.
The SailChart used is the one selected in the routing menu.
Activate the dry point compass, the best sail is displayed in the information bubble.
This function is convenient to anticipate the sail to be used on the next leg.
In the example below, I am upwind towards the buoy "Roche du Sud".
What will be our speed and the sail to use on the next leg between "Roche du Sud" and Aix NW?

We will be on starboard tack with a 120° true wind angle, under Code 5
This function uses the instantaneous wind measurement (TWD and TWA) from the NMEA flow.
The SailChart used is the one selected in the routing menu.
If the option "Boat to map center line" is checked in the Settings > GPS NMEA AIS menu, the distance, heading, TWA and optimal sail indications are displayed.
In this example, if we hit the AIXNW buoy located at 5.6Nm in the 184°, we will besailing with a 87° TWA and the optimal sail will be our J2.

Yes, the algorithm can evaluate if the boat is sailing in a "crossed sea" and, if so, degrade the polar by a certain coefficient.
To consider that the sea is crossed, we need the following conditions:
- the significant height of the total sea is greater than a certain threshold
- the angle between the direction of the swell and the wind waves between 45° and 135°.
You can also use the following method:
Load a wave grib file (ww3 model) and study the waves forecast. If the waves are too strong, you can either:
- limit the maximum wind speed
- create restricted areas
- add a waypoint to your route
- use pivot points to avoid these areas
No go zones are polygons created by the user that will be avoided by the routing algoritm if selected.
They are frequently used to avoid sailing in Traffic Separation Scheme (TSS), avois shalow or danger areas...
To create the no go zones:
- I recommend that you first select the option to enter waypoints and other "points" on the map at the center of the screen as opposed to where you pressed the screen. The input, if less natural, is more precise. To do do go to the General section of the Settings menu and select the Waypoints at screen center option.
- center the map where you want to start your no go zone
- long press the screen
- select the "No go zone" menu
- select the "Create a no go zone" menu
- enter a name for the no go zone or leave the default one and press Ok . The first point is created
- move the map where you want to continue your no go zone
- long press the screen and select "Add a point to the no go zone"
- repeat the 2 previous action until your no go zone is complete
Then in the routing menu, make sure you have checked the "No go zones" option.
Since March 2021, you have the choice between 5 sources :
- GeoGarage
Geogarage offers a very large catalog of raster nautical charts derived from digital charts provided by the International Hydrographic Services.
These charts, updated very frequently, are available as annual subscription to a hydrographic service such as SHOM, UKHO, NOAA...
Note that the same subscription can be used in SailGrib WR on your Android devices (phone, tablets and Chromebooks) and in Weather4D on your iPhones and iPads.
You will find the Geogarage catalog by following this link : https://www.geogarage.com/en_EN/page/catalog
The purchase of subscriptions is done on the Geogarage website. : https://accounts.geogarage.com/en/L'utilisation des cartes est très simple:
- Sur le site de GéoGarage
- Créer un compte Géogarage
- Souscrire à un abonnement
- Dans SailGrib WR
Visionez un petit tuto ici : https://youtu.be/b4mSCydOfVw
- Aller dans Préférences > Cartes
- Entrer l'adresse mail et le mot de passe utilisés pour créer votre compte GeoGarage
- Choisir le service hydrographique dont on veut afficher les cartes
- Retourner sur l'écran principal de SailGrib WR et choisir la couche GeoGarage
Les cartes se chargent à la volée et sont stockées dans le cache cartographque de l'application. - Télécharger toutes les cartes de votre zone de navigation
- Aller dans Préférences > Cartes et cliquer sur "Télécharger des cartes"
- Choisi le niveau de détail souhaité. Le niveau cotier conviendra pour la plupart des zones de navigation cotière.
- Déplacer la carte et zoomer, la zone est définie par le carré de couleur
- Cliquer sur le bouton Télécharger
- Un atlas de cartes est créé sur les serveurs de GeoGarage puis téléchargé sur votre appareil
- Retourner sur l'écran principal de SailGrib WR
On the GeoGarage website : https://accounts.geogarage.com/en/
- Create a Geogarage account
- Subscribe to a subscription
- Go to Preferences > Maps
- Enter the email address and password used to create your GeoGarage account.
- Select the hydrographic service whose charts you want to display
- Return to the SailGrib WR main screen and choose the GeoGarage layer.
Maps load on the fly and are stored in the application's map cache.
- Go to Preferences > Charts and click on "Download Geogarage charts".
- Choose the desired level of detail.
- The Offshorelevel will be used to load large areas. Attention, detail maps will not be loaded.
- The coastal level will be suitable for most coastal navigation areas.
- The Harbor level loads detail maps. It is very rarely necessary to use it.
- Move the map and zoom, the area is defined by the square of color
- Click on the Download button
- A map atlas is created on the GeoGarage servers and then downloaded to your device in the sailgrib/geogarage directory in the main memory of your device.
This atlas is yours, you cannot share it with your friends.
You can, on the other hand, copy it to another of your devices.
No, the Geogarge maps for SailGrib WR are stored in the sailgrib/geogarage directory of your device.
- Go to Preferences > Charts and click on "Download GeoGarage charts".
- Already downloaded zones are displayed
- A message is displayed in the center of the zone if an update is available.
- Click on the dot in the center of the area and then click on the Update button.
- Go to Preferences > Charts and click on "Download GeoGarage charts".
- Already downloaded zones are displayed
- Click on the dot in the center of the area and then click on the Delete button.
No, you need either:
- the free version of SailGrib WR with the Premium option
- the paid version of SailGrib WR
and a valid GeoGarage subscription.
Request a password reset : https://accounts.geogarage.com/account/password/reset/
- Enter your email address.
- Click on the button "Reset my password"..
- If this email address is recognized, GeoGarage will send you an email that will allow you to re-initialize it.
- If it is not recognized, you took your subscription with another email address, enter the one you used to take your subscription.
If you encounter difficulties to reset your password, contact Geogarage at the following address: contact@geogarage.com.
- Sur le site de GéoGarage
- Navionics
You have a Navionics Boating subscription? Use your Navionics charts directly in SailGrib WR at no extra cost.
No, Navionics chars for SailGrib WR are stored in a protected SailGrib WR directory in the application's main memory. You don't have access to it.
Navionics charts for SailGrib WR are stored in a protected SailGrib WR directory in the app's main memory. It may not be optimal, but that's how sdk Navionics was coded.
To date, the Navionics Android sdk does not offer a quick and easy update function.
The only solution we found was to remove the data and cache from the app and then download the charts again...
To remove the data and cache from the app, do the following:
- Open the device Settings app
- Tap Apps
- Scroll down to SailGrib WR and tap Storage
- Press Clear Data and Clear Cache (If "Clear Data" is not displayed, tap Manage Space.)
Yes, go to Settings > Charts and pick the unit between:
- meters
- feet
- fathoms
Yes you can, here are two screenshots of the mooring between Tresco and Bryher in the Scilly islands.
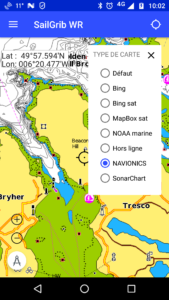
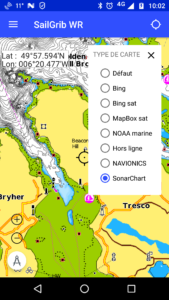
Yes you can. Go to Settings > Charts and pick the number of units for the "Depth area visibility threshold".
This is very convenient. If you boat draught is, for example, 1.9 meters, set the parameter to 2 meters. Then, if the chart is white, you are always Ok, if it is blue, you have to do your tide calculation.
Here are two screenshots of the mooring between Tresco and Bryher in the Scilly islands with a parameter set at 5 meters and another set at 2 meters.
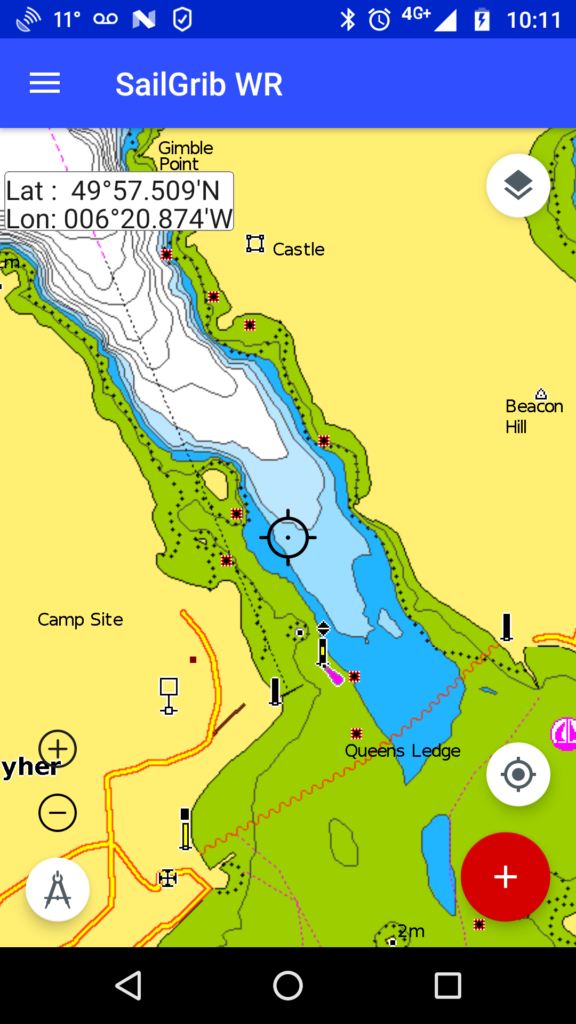
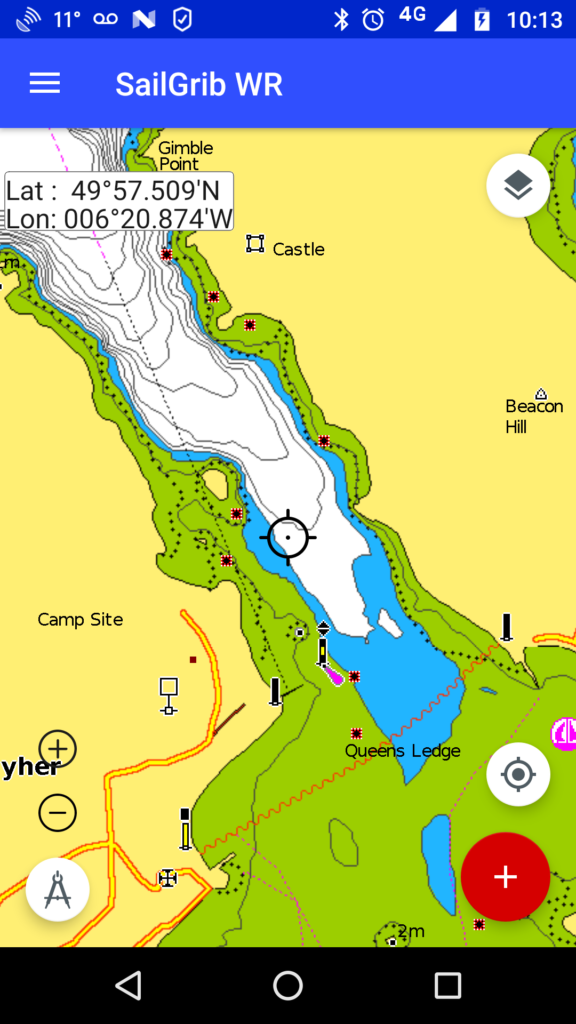
- Open the device Settings app
- Chart atlases in SGTiles format
These atlases of raster charts purchased as in-app purchase before March 2021 come from hydrographic services such as SHOM and UKHO.
These atlases, which are difficult to update, are no longer sold in the app. They have been replaced by the GeoGarage service. - Chart atlases in MBTiles format proposed in the application
Ces atlas de cartes raster, principalement de la NOAA, sont proposés gratuitement dans l'application.
They are updated by NOAA very frequently. - Your own charts in MBTiles format
This is the map format specified by MapBox. (https://docs.mapbox.com/help/glossary/mbtiles/)
Many tools are available on the Web to create charts in this format.
No, this is not possible, you must be connected via WiFi.
Yes, you must install an app like Bluetooth GPS and designate it as the mock location provider in Android.
This works perfectly and saves the mobile phone battery.
You can use an ultra-precise bluetooth GPS that picks up Galileo satellites and supports EGNOS technology in Europe and WAAS in the United States. You should get an accuracy of less than one meter. The best one today is the GNS2000 Plus that you will find for about 100€.
To use it, you need:
- load a Bluetooth GPS application
- Allow Developer Mode: In the Android menu, go to: System / General Settings / About Device / Tap up to seven times the Build Number to unblock Developer Options.
- in the Options menu for developers, choose Bluetooth GPS as the "dummy position provider".
- then, like any Bluetooth device, pair the GPS and the phone.
You need to uncheck the mobile data on your phone.
Check the following points:
- You are connected to the WiFi network broadcasting NMEA data
- Mobile data are off if you use a phone
- You have allowed mock locations and SailGrib WR is the mock location provider
- You have activated "NMEA and AIS Connection" in "NMEA Settings"
- You have selected the correct NMEA data source. If your device is not referenced, you have filled in the 3 fields: protocol, IP address and port.
- Stop and restart the NMEA service in "NMEA Settings". You should see the last 10 NMEA messages received.
The Navygatio service offers the following services :
- Record all your sailing in SailGrib WR and Weather4D
- Save them on a server
- View them in near real time on www.navygatio.com
- Replay them at any time on www.navygatio.com
- Share your navigations with your friends registered on Navygatio
Today in Beta version, you will soon be able to :
- analyze your performance
- share your navigations publicly
- enter your log directly into SailGrib WR or Weather4D and on navygatio.com
- illustrate your navigations with photos
Here is for example the track of the SunFast 3200 "SailGrib" during the Gascony 45/5 race in May 2019.
The data was recorded every second.

In SailGrib WR
- Press the + button at the bottom right and then the Preferences button
- Select Navygatio
- Press the Connect button
- Select your Google Account
- Your account is created on Navygatio with a boat "My boat" and an activity "My activity
You can then modify these names, add other boats or activities on the navygatio.com website.
For example, I named my boat "cdc3" and an activity "Regatta".
Once you have created an account, as soon as you start a navigation, its data will be recorded and transferred in near real time to the Navygatio servers.
- Data is recorded every second. The frequency can be adjusted in the Navygatio configuration screen.
- If your device has an Internet connection, data is transmitted to the Navygatio server every 10 minutes. The frequency can be adjusted in the Navygatio configuration screen between 1 minute and 6 hours.
If you're going offshore, it's best to change this transmission frequency to 6 hours and uncheck the transmission option. You can check it again when you reconnect to the Internet and the files will be uploaded to the Navygatio servers automatically. - Sf you lose your Internet connection, your data will be transmitted as soon as you regain a connection and SailGrib WR is open. For example, if you connect your phone to an internal on-board network to receive NMEA data, most of the time it will lose its connection to the Internet. As soon as you disconnect from that internal network and connect back to the Internet, your navigation data will be uploaded to the Navygatio servers.

Simply enter your boat's MMSI number in the boat configuration screen accessible by clicking on your profile picture at the top right of the navygatio.com home screen

Once your MMSI is registered in Navygatio, as soon as your ship's AIS is visible on the AISHub network, the transmitted AIS messages will be stored on the Navygatio servers.
Upon first receipt, an AIS tracking activity and a Track event will be created for your vessel.
You will then have access to your track.


1/ Enter the phone number of your Iridium Go in the Navygatio website
Enter your boat's Iridium Go phone number in the boat configuration screen accessible by clicking on your profile picture at the top right of the navygatio.com home screen
The number must be entered in international format without the + or 00.
For example :
881631015375 for standard Iridium numbers that start with 881
or
12126981315 for US flex numbers marketed by Pivotel

2/ Configure tracking in the Iridium Go
- On your Android (or iOS device), install the Iridium Go app from the Play Store (or App Store)

- Start the Iridium Go
- Connect to the Iridium Go WiFi network
- Launch the Iridium Go app and connect to the Iridium Go
- Go to the Settings > Track menu
- Choose a Tracking Frequency
We recommend 30 minutes for long crossings, you can go down to 5 minutes. - Enter the tracking email address in the Tracking recipient field
iridium@navygatio.com - Press the back button then Save
- Make sure that the GPS of the Iridium Go is activated by going to the menu Settings > Power
3/ Sail
When sailing, keep the Iridium Go on, an SMS will be automatically sent every n minutes depending on the tracking frequency you choose.
If you have an unlimited data subscription, which we recommend, your package includes unlimited SMS and you will not have any additional cost.
If your subscription does not have unlimited data, you will be charged for each SMS sent, ask your provider for the cost.
4/View your track on Navygatio
During your first sailing trip, after receiving 2 tracking messages from your Iridium Go, an Iridium tracking activity and a Track event will be created for your boat.
You will then have access to your track.


Or for a friend's boat

The management of your account is done on navygatio.com
Navygatio uses a mechanism that allows immediate synchronization of your information between the different media (website, SailGrib and Weather4D).
For example, if you add a boat on the website, you can immediately select it in SailGrib.
- My account
- Your boats
Add, edit, delete your boats
- Your followers
To view a friend's sailing trip, you and your friend must be registered with Navygatio.
Ask your friend to add you to his list of friends by telling him what e-mail address you used when you registered.
Activities
You navigations belong to one activity.
You can create as many activities as you want. For example: Cruising, Racing, Training...
To create an activity, press the + button under the last created activity.

Navigation
When you activate the Navigation mode in SailGrib WR, a new navigation is created in Navygatio in the activity selected in SailGrib's Navygatio Settings screen.
This new navigation is immediately added to navygatio.com.

When you point your mouse on a navigation, 3 dots appear on its right side which allow you to open a menu.

You can then:
- duplicate it
- change the activity
- add it to another navigation
- rename it
- delete it
Since version 7.0 released in February 2023, the application files are no longer stored in the sailgrib directory of the main memory of the device.
Google forces us to put them in a hidden directory ( /storage/emulated/0/Android/data/com.sailgrib_wr.paid/files/sailgrib/) .
The most visible consequence for users is that if you save a grib file from an email for example, it is no longer directly visible by SailGrib WR.
You have to import it.
To do this, we have created a new Menu "Import a file".
The application will search for files by default in the Download directory.
You can sort them by date to have the most recent files at the top of the list
Choose the file to import, it will be copied and available in the application.
Since version 7.0 released in February 2023, the application files are no longer stored in the sailgrib directory of the device's main memory.
Google forces us to put them in a hidden directory (/storage/emulated/0/Android/data/com.sailgrib_wr.paid/files/sailgrib/).
The most visible consequence for the users is that if you want to share for example a route, you can't do it with a file manager anymore.
For this we have created a new Menu "Share, save or delete a file".
If you decide to save a file, it will be saved in a subdirectory of download/sailgrib
SailGrib WR's polar library includes more than 400 boats. Most of these polar are theoretical and come from software called VPP (Velocity Prediction Program).
They are often optimistic and must be adjusted according to the way you sail.
To display a polar, go to the left menu and choose "polar".
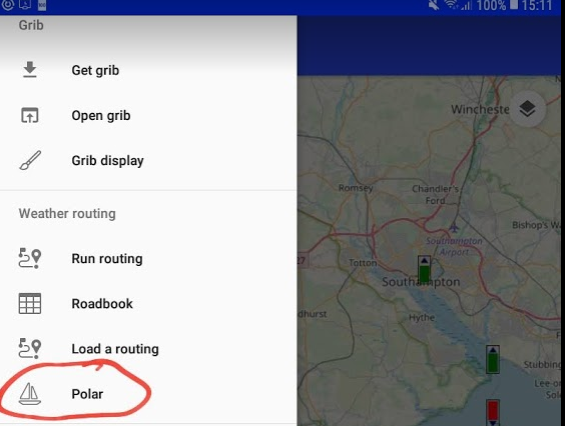
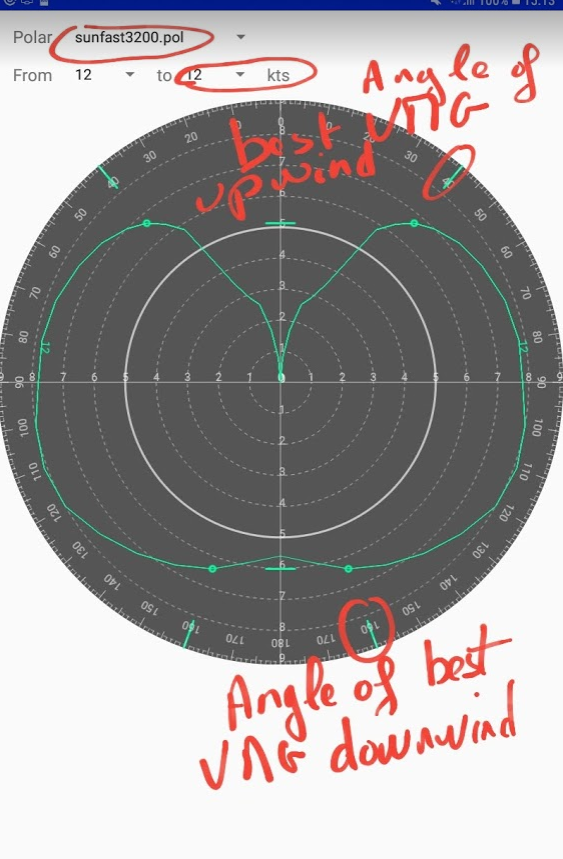
Take a good look at the speeds indicated by these polar diagrams at different true wind angles and ask yourself the question: is this reasonable for a routing?
Here, for example, for a Sun Fast 3200 in 12 knots of wind.
- upwind, a boat surface speed or speed through water (STW) of 6.8 knots with a true wind angle (TWA) of 40°, is this reasonable for a routing? My answer is No, most likely I will sail around 6.2 knots with a TWA of 45°. The polar speed for a TWA of 45° is 7.1 knots. I will therefore sail at 87% of the polar with a 45° limit.
- crosswind, a STW of 7.8 knots for a 90° TWA, is this reasonable for a routing? My answer is No, I will sail at around 7.2 knots or 92% of the polar.
- downwind, a STW of 6.2 knots for a 160° TWA, is this reasonable for a routing? My answer is No, I will sail at around 5.8 knots or 93% of the polar.
With this quick approach, I believe I should sail at around 90% of the boat polar at 12 knots with a 45° upwind limit.
In the app, you can easily modify a polar in the routing menu using the following settings:
- a minimum upwind angle: if, as in the example above, the theoretical polar indicates an upwind angle of 40° in 12 knots of true wind, this is probably impracticable when sailing. Enter 45° for this parameter.
- a maximum downwind angle: this is more for safety reasons. If the theoretical polar indicates a downwind angle of 175° for 12 knots, it is probably not a good idea when sailing and you don't want the routing to propose that. For example, enter 165° for this parameter. An autopilot will probably be able to steer in true wind mode at 165° without risking gybing. In the above case, the best downwind angle at 12 knots is 160°, the polar at 12 knots will not be affected by this parameter.
- 2 polar efficiency coefficients. One below 10 knots of true wind, the other above 20 knots. To ensure continuity, the app will linearly interpolate the coefficient between 10 and 20 nodes. If cruising, you should notice that you sail between 70% and 75% of the theoretical polar in light winds and between 75% and 80% above 20 knots. For racing yachts we can see that we are generally around 90% of the theoretical polar and sometimes around 85% in light airs.
If you have connected the app to the boat's NMEA data, this output can be displayed permanently. Even better, you can display the graph of this performance with the Histograms module. Use these indications to adjust the coefficients in the routing menu.
Here, we sail at 91% of the Sun Fast 3200 polar by 16 knots across, the sea is flat.
The efficiency percentage is very stable around 90%. We take a reef to see how the boat behaves. No significant change in performance. The reefing lasted 2 minutes and the efficiency percentage fell to 72% during this time. In a race, at 7.7 knots, we would have lost around 85 meters or 8 boat lengths...
When navigating to a given waypoint, create a mark at that waypoint location and activate it.
The app will give you the basic navigation data:
BTW : Bearing to waypoint
DTW: Distance to waypoint
VMC: Velocity Made on Course, this is the speed of approach to the waypoint
TTG: Estimated sailing time to this waypoint at the VMC
ETA: Estimated time of arrival at the waypoint
1/ Create a Mark:
- if you have checked the option "Waypoint at screen center":
* center the map on the desired location
* make a long press anywhere on the map
if you have not checked the option "Waypoint at screen center":
* make a long press at the location where you want to create a waypoint
- choose the Manage Marksmenu
- choose the Create a mark option
- enter a name and choose an icon for this mark
- press the Save button
2/ Activate a mark:
- if you have checked the option "Waypoint at screen center":
* center the map on the desired mark
* make a long press anywhere on the map
if you have not checked the option "Waypoint at screen center":
* make a long press on the mark you want to activate
- choose the Manage Marks menu
- choose the Activate mark option[mark name]
If you go offshore, remember to save the app on your device, this will allow you to reinstall it without an Internet connection.
The easiest way to do this is to install the App Backup & Restore app and make a local backup of the SailGrib WR apk installation file.
Make a backup
- Click on the "Installed" tab
- Select the app to be backed up
- Click on the Save selected apps button
-
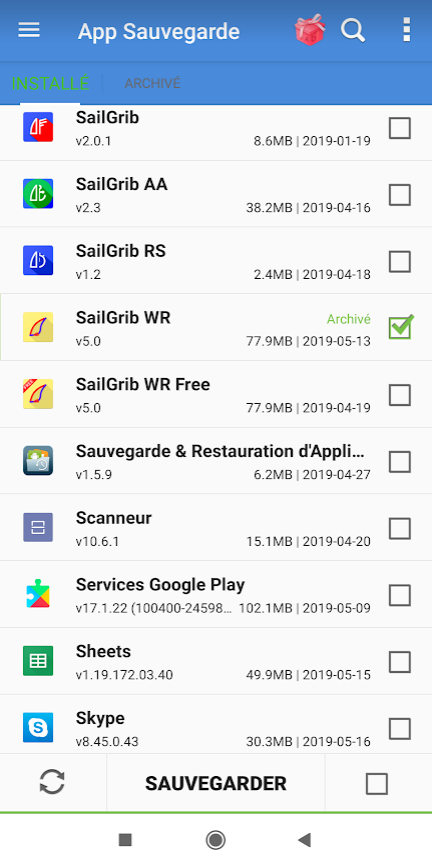
Restore an archived app
- Click on the "Archived" tab
- Select the app to restore
- Click on the Restore selected apps button
If you go offshore, remember to save your Navionics charts on your device, this will allow you to reinstall them without an Internet connection.
Here is the procedure:
In SailGrib WR, go to the Settingsmenu > Charts
Press the Backup your Navionics charts button
Confirm backup
If you "lose" your Navionics charts offshore or need to reinstall the app, you can then recover them with the following procedure:
Go to the Settings menu > Charts
Press the Restore your Navionics charts button
Confirm restoration
Note that you can do the backup procedure manually using a file manager.
Copy the entire
Android/Data/com.sailgrib_wr.paid/files/com.sailgrib_wr.paid/Navionics
directory to the
sailgrib/navionics_backup
directory on the main memory of your device (eventually create it).
Once you have erased the SailGrib app data, restore your Navionics charts: Settings>charts > Restore Navionics charts.
We do our best not to let this happen, but if for some reason the app crashes systematically at startup, you can recover it by resetting all the apps settings to their default values. To do this, you will need to delete all the data in the app.
WARNING: this will erase your Navionics charts used in the app. Make a backup of these files first.
- either in the app if you can still access it. Settings > Charts > Backup Navionics charts
- using a file manager copy the entire
Android/Data/com.sailgrib_wr.paid/files/com.sailgrib_wr.paid/Navionics
directory to the
sailgrib/navionics_backup
directory on the main memory of your device (eventually create it).
Once you have erased the SailGrib app data, restore your Navionics charts: Settings>charts > Restore Navionics charts.
Here is the procedure to follow:
- Open the Android Settings app
on your device.
- Tap apps and notifications.
- Tap Show apps
- Choose the SailGrib WR app
- Press Storage
- Tap Clear data. If the "Clear data" option is not displayed, press Manage space and delete the data
SailGrib WR displays AIS targets received over the Internet through the AISHub service.
We encourage you to contribute by sharing data from your AIS receiver while sailing. This will turn your boat into a mobile station. Targets received by your boat's AIS receiver will be displayed in green, those received by the Internet in blue.

Here is the procedure to follow:
- Go to the GPS NMEA AIS menu > AIS settings
- Check Share AIS data. These data will be disseminated on AISHub. They will be accessible on SailGrib WR, Weather4D and all sites like MarineTraffic, VesselFinder...
- Check Share own ship data. Meteorological or hydrological data from the boat such as average wind speed and direction, gusts, atmospheric pressure will be shared with all SailGrib WR and Weather4D users. The targets will appear in light blue on the screen.


If you have difficulties connecting to the NMEA + AIS feed via WiFi and at the same time remain connected to the Internet via 4G, you must delete the "default gateway" of your NMEA + AIS multiplexer
- Open the Android Settings app
on your device.
- Go to the WiFi settings
- Select the WiFi network of the multiplexer to which you are connected and display its settings.
- In the IP settings, change DHCP Protocol to Static (or Manual)
- Delete the default route or gateway (often of the type 192.168.86.1)
- Press the Edit Network button
You should now be able to receive your NMEA and AIS data while remaining connected to 4G.
Be careful, this procedure does not work with all multiplexers. Some, like the vYacht, refuse to delete the "default route".
AISHub is a real-time AIS data sharing network to which SailGrib contributes and subscribes.
This allows you to view the AIS data of the AISHub network in SailGrib WR.
Unfortunately, not all areas are covered by AISHub. We encourage you to contribute by setting up an AIS station in your home. You can find the AISHub real-time coverage map here.
Here is the AISHub coverage of the England south coast on May 22, 2019
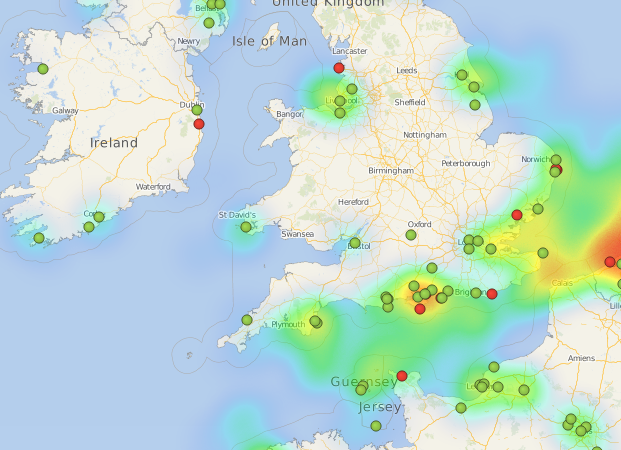
How to install a fixed AIS station and share data?
- live by the sea and have a relatively clear view.
- build an AIS station for about 250€
- Place the receiver in a waterproof electrical box, and install it on a mast with the AIS antenna. Install and configure rPiAIS (it's very simple).
- Connect the Raspberry to the Internet and to the AIS receiver with the USB cable.
- Plug it in
